• exhibitions+
  • information design
  • book design
  • student work
  • scholarly work
Menu

TH+INK

  • exhibitions+
  • information design
  • book design
  • student work
  • scholarly work

future work : environmental graphics (2020-) for nuthatch hollow nature preserve

Since 2018, I have been contributing communication design concepts to the Nuthatch Hollow Nature Preserve and the Living Building projects that are led by Pamela A. Mischen, CCPA, and includes faculty members across several university departments and schools.

These environmental infographics are a collaboration between me and Colin Lyons (art and design, BU). I am providing designs that convey natural cycles to be integrated into site-specific installations that will be devised by Colin. Two of these designs are presented here representing the carbon cycle as it applies to the forest habitat, and the water cycle as it relates to wetlands—two of the several regions that the Nuthatch site inhabits.

nth-01.jpg
nth-02.jpg

cognitive art of CO2 (2020) artist's book

Materials Matter design sessions gave way to my own exploration of scientific notation in the form of an artist’s book titled Cognitive Art of CO2: from ball and stick to VB model and beyond (grant 2019, exhib. 2020a, 2020b).

In this work, graphics are walking the reader through 12 different notations used to express the carbon dioxide molecule. This book serves to illuminate how scientists modulate their ways of expression as they change their focus on notions relating to the molecule.

CO-2-cover.jpg
CO2-pages-2021-11.png
CO2-pages-2021-11b.png
CO2-pages-2021-12.png
CO-2-pages_0038_DSC_0121.jpg
CO-2-pages_0037_DSC_0122.jpg
CO-2-pages_0035_DSC_0124.jpg
CO-2-pages_0033_DSC_0126.jpg
CO-2-pages_0030_DSC_0129.jpg
CO-2-pages_0029_DSC_0130.jpg
CO-2-pages_0027_DSC_0132.jpg
CO-2-pages_0026_DSC_0133.jpg
CO-2-pages_0022_DSC_0137.jpg
CO-2-pages_0023_DSC_0136.jpg
CO-2-pages_0020_DSC_0139.jpg
CO-2-pages_0017_DSC_0142.jpg
CO-2-pages_0016_DSC_0143.jpg
CO-2-pages_0015_DSC_0144.jpg
CO-2-pages_0014_DSC_0145.jpg
CO-2-pages_0013_DSC_0146.jpg
CO-2-pages_0012_DSC_0147.jpg
CO-2-pages_0011_DSC_0148.jpg
CO-2-pages_0010_DSC_0149.jpg
CO-2-pages_0009_DSC_0150.jpg
CO-2-pages_0008_DSC_0151.jpg
CO-2-pages_0005_DSC_0154.jpg
CO-2-pages_0004_DSC_0155.jpg
CO-2-pages_0003_DSC_0156.jpg
CO-2-pages_0002_DSC_0157.jpg
CO-2-pages_0000_DSC_0159.jpg
CO-2-pages_0001_DSC_0158.jpg

intelligence emerges (2018) cover art for the design issues journal

Design Issues Journal cover art, Design Issues 34, no. 1 (Winter 2018).

I took a poetic infographic approach for this cover image. Intelligence emerges and gains ability to transform earth (back cover), then extracts, processes, and reacts upon the debris produced by this creative process (front). The background pattern reflects elements fundamental for existence, life and intelligence.

To design the iconography that I produced for this cover, I drew on a library of nearly 400 images that I compiled by visual research, sketching, and drawing. References include scientific representations, paintings, drawings, and photography.

click here to see the larger image

po02-01.png
po02-02.png
po02-03.png
po03-31.jpg

STEM Toolbox (2019-present)

Design work for the Materials Matter App inspired the development of a research and learning tool called STEM Toolbox, that features multi-media infographics capable of describing cutting edge research in a broad range of material classes, including energy materials. The STEM Toolbox is a partnership between graphic designers and physicists to provide a visual framework to introduce key concepts regarding light-matter interactions that define our interactions with the world around. The philosophy behind this initiative is to visually describe mathematical solutions of scientific concepts with the use of infographics. The design research team was lead by Louis Piper, director of the Institute for Materials Research 2.0 (IMR 2.0) at BU.

A majority of the STEM Toolbox modules serve to contribute to broader impacts of grant-supported research performed at IMR 2.0, disseminated through presentations.

STEM Toolbox infographic modules (“Hard X-Ray (HAXPES) Lab,” “Li-ion battery,” “Mem-diode”) discuss scientific discoveries at all levels—from the layperson to the expert. For example, the graphical STEM Toolbox can be used as both an education and research tool for examining the reactions occurring at the atomic level within a Li-ion battery—first developed by Nobel Laureate M. Stanley Whittingham (Binghamton University).

The “Li-ion battery” infographic received a shortlist award in the 2020 Institute for Information Design competition (IIIDAward). Dr. Piper and I received the 2020 BU Smart Energy TAE grant to further develop this module into a “Guided Tour through the Operation of a Li-Ion Battery.”

The web-based app that will house the infographics of fundamental science and research stories is in development.

Copyright © Louis Piper, Gökhan Ersan, SUNY, RF SUNY / 2017, 2018, 2019, 2020.  All rights reserved.  These STEM Toolbox digital infographics may not be published, reproduced, displayed, modified or distributed without the express prior written permission of the copyright holder. For permission, contact [gersan@binghamton.edu]

st0-01.jpg
stem-tb_Page_1.jpg
stem-tb_Page_2.jpg
stem-tb_Page_4.jpg
 This sequence illustrates how the app’s framework can usher viewers into energy data that comes from a few atoms to bulk matter formed by many atoms of the two elements (Fe, O) of a metal oxide crystal.

This sequence illustrates how the app’s framework can usher viewers into energy data that comes from a few atoms to bulk matter formed by many atoms of the two elements (Fe, O) of a metal oxide crystal.

STEM Toolbox module (2020) HAXPES

STEM Toolbox infographic module “Hard X-Ray (HAXPES) Lab”, discuss how Binghamton University researchers can study smart energy materials with the aid of BU’s HAXPES system, the first of its kind in the US. This is a collaboration between me and Louis Piper, that supports the ‘broader impacts’ of NSF award 1919704 (Project Title: MRI: Acquisition of a Hard X-ray PhotoElectron Spectroscopy (HAXPES) for the Institute for Materials Research (IMR) at Binghamton University (BU). PI/co-PI(s): Mark Poliks, Natalya Chernova, Guangwen Zhou, Louis Piper, Tara Dhakal).

HAXPES stands for Hard X-ray PhotoElectron Spectroscopy. This motion graphic illustrates how x-rays help measure the chemical and electronic configuration of materials. HAXPES device is capable of producing different levels of x-rays that can be focused at different physical and electronic levels, gathering a broad range of data from a given sample. The motion graphic illustrates the entire data analysis process, starting with the recorded data, and illustrating the backward steps scientists take in processing this data through a series of mathematical functions. The viewers watch all of this on the same stage, simultaneously when inset frames pop-up to provide insights into the different physical and electronic layers that are focused.

Copyright © Louis Piper, Gökhan Ersan, SUNY, RF SUNY / 2017, 2018, 2019, 2020.  All rights reserved.  These STEM Toolbox digital infographics may not be published, reproduced, displayed, modified or distributed without the express prior written permission of the copyright holder. For permission, contact [gersan@binghamton.edu]

13-B-1 electron path-01.jpg
13-B-2 Fc centripetal force-01.jpg
13-B-3 V velocity-01.jpg
13-B-4-2 kinetic energy-01.jpg
13-B-50-01.jpg
13-B-50-ANIM-04-01.jpg
13-B-50-ANIM-15-01.jpg
13-B-53-01.jpg
13-B-70-02-01.jpg
13-B-70-02-01c.jpg
13-B-90 TiO2 hex structure-01.jpg
13-B-111 zoom out-01.jpg
13-B-130 micrograph-01.jpg

STEM Toolbox module (2020) Li-ion battery

The “Li-ion battery” infographic received a shortlist award in the 2020 Institute for Information Design competition (IIIDAward). Dr. Piper and I received the 2020 BU Smart Energy TAE grant to further develop this module into a “Guided Tour through the Operation of a Li-Ion Battery.”

Although basic working principles of Li-ion battery is illustrated diagrammatically before, it is challenging to explain the subtleties that go into ‘improving’ them to a broad audience. IMR at SUNY Binghamton wanted to visually explain the underlying principles of lithium intercalation at the atomic level given that their member Stanley Whittingham received the 2020 Nobel prize in chemistry for developing the lithium ion battery. They wanted to make a scientifically rigorous explanation of the Li-ion battery to a range of stakeholders—from college students and researches to the private and public decision-makers—by utilizing infographics.

This motion graphic tells the story of ‘lithium intercalation’ during when a coin cell battery powers a wrist watch. Evidence from multiple research results are streamlined into a visual narrative that takes viewers from the the battery’s anode into its cathode. The camera dives inside the anode, showing in multiple length and time scales, how lithium ions travel inside anode’s crystal framework.

st2-01c.jpg

STEM Toolbox module (2019) Mem-diode

This infographic explains performance improvements that new materials provide to the operation of neuromorphic computing devices. I collaborated with researchers Louis Piper, Wei-Cheng Lee, and research assistant Christopher Singh at Binghamton University Physics department to produce this work that is meant to serve as a research and learning tool, that is integrated into the STEM Toolbox.

The infographic contributed to broader impacts of a recent grant, and accompanied related presentations.

Grant : Scalable neuristors for neuromorphic computing: Shining (synchrotron) light on the role of Mott physics. Air Force Office of Scientific Research under Award No. FA9550-18-1-0024).

Conference : “Exploring New Science Frontiers at NSLS-II”, Stony Brook University and Brookhaven National Laboratory (BNL), October 21-23, 2019., grants Louis Piper.

st3-02-electrons are localized.png
st3-03-electrons delocalized.png
st3-04-more current pushed.png
st3-05-current pushed back.png
st3-07.png
st3-08.png
st3-09.png
st3-10.png

STEM Toolbox module (2019) why is emerald green?

This infographic answers the question “why is emerald green?” It was born out of a Materials Matter course lecture given by Joshua Young, postdoctoral research associate in the Physics Department at Binghamton University. The physicist’s answer to that question proved a comprehensive one that required compacting many layers of explanation.

Young and I decided to streamline all of the informational layers within a single visual sequence. During summer 2019, we met regularly to produce new resource materials, and to develop designs that would enunciate crucial concepts, building the resulting motion graphic.

The motion graphic accounts for why emerald is perceived as green, from the level of how two elements bond (the metal oxide colorant) to the unit cell and the crystal framework, up to the level of bulk matter (emerald mineral). In the process, the infographic shows the particular electron-energy level splitting and network modification that produces the specific photon wavelengths that are transmitted through the emerald mineral. The final segment shows how an observer synthesizes those photons within the perceptual color space (CIE) into the sensation we call “emerald green.”

Copyright © Louis Piper, Gökhan Ersan, SUNY, RF SUNY / 2017, 2018, 2019, 2020.  All rights reserved.  These STEM Toolbox digital infographics may not be published, reproduced, displayed, modified or distributed without the express prior written permission of the copyright holder. For permission, contact [gersan@binghamton.edu]

st4-02.jpg
st4-03.jpg
st4-04.jpg
st4-05.jpg
st4-07.jpg
st4-06.jpg
st4-08.jpg
st4-09.jpg
st4-10.jpg

STEM Toolbox module (2019) covalent bonding

Materials Matter design sessions prepared our team to make more detailed descriptions of scientific concepts. This STEM Toolbox module uses a new graphical framework to explain covalent bonding at multiple-scales. I collaborated with Lynn Schmitt at Binghamton University chemistry department to develop this module.

The infographic begins with a simplified electron cloud picture showing how two elements (Fe, O) that are attracted to each other transmorph to form a molecule. This picture is repeated in three alternative views, showing the covalent bond in terms of primary (n), and secondary (spdf) quantum numbers, and as electron probability clouds. This atomic picture is paralleled with an electron band graph (the vertical bar) displaying distinct energy levels that partake in bonding of a few atoms. We, then, zoom out to show more and more atoms of the same two elements forming larger arrays of atoms, causing energy ‘bands’ to form.

This infographic serves to prepare learners for a closer study of different classes of materials that are integrated into the toolbox as advanced learning modules.

Copyright © Louis Piper, Gökhan Ersan, SUNY, RF SUNY / 2017, 2018, 2019, 2020.  All rights reserved.  These STEM Toolbox digital infographics may not be published, reproduced, displayed, modified or distributed without the express prior written permission of the copyright holder. For permission, contact [gersan@binghamton.edu]

st5-01.jpg
st5-02.jpg
st5-03.jpg
st5-04.jpg
st5-05.jpg
st5-06.jpg
st5-07.jpg
st5-08.jpg
st5-09.jpg
st5-10.jpg
st5-11.jpg
st5-12.jpg
st5-13.jpg
st5-15.jpg
st5-14.jpg
st5-16.jpg
st5-17.jpg

materials matter app (2017-present)

Design components for the Materials Matter Interactive App in support of two interdisciplinary courses, a freshman seminar that supports undergraduate research (SCHL 281F Materials Matter) and a General Education course that fulfills both Laboratory and Aesthetics designations, through a rigorous focus on specific materials— pigment, ceramics, and glass. Both course initiatives are grant funded (SUNY 2017 IITG TIER 2 Round 6 and NEH grant for Promotion of the Humanities Teaching and Learning Resources and Curriculum Development.)

The Materials Matter App is conceived to replace the conventional powerpoint slide lecture. The App’s design framework mirror’s course’s pedagogical framework, guiding users through conceptual layers, spatial and temporal scales of the material world. App serves to bring together lessons in chemistry, art history, classical archaeology, and design. In this ongoing project, I keep collaborating with different content-providing lecturers and science advisors to develop infographic lesson modules that will be integrated into the app.

After several iterations of the course, researcher Marvin Bolt (Berlin) conceived a new immersive framework. The new layout allows the teacher to build a lecture by adding visual nodes to map out conceptual relationships between the humanistic and scientific layers of materials. I have been working with Bolt and software developers to implement this new version that will be utilized in the classroom.

Multi-scale analysis and discussion page

App’s layout allows the teacher to build a lecture by adding visual nodes to map out conceptual relationships between the humanistic and scientific layers of materials. Certain nodes will be hyperlinked to infographics that will explain scientific layers of objects intuitively.

materials matter app module (2017) light-matter interactions

This module introduces the concept of how scientists characterize elements through studying light-matter interactions. I collaborated with research assistant Todd Rutkowski from Binghamton University physics department to streamline this story within the stage of a simple experimental set up—of light passing through a prism.

The story begins when a light switch is turned on, propagating photons into space. The camera follows a beam of red light, as infographic frames reveal the particle and wave properties of a photon. Then, several beams merge to form the visible color spectrum that is projected onto the larger electromagnetic spectrum (ems). Camera, then, zooms out to reveal the entire experimental set up—of white light that passes through a slit shot into a prism getting refracted into its various color components. This, the infographic, reveals is ‘continuous spectra.’ As we change the light source, our infographic also reveals absorption and emission spectra.

This infographic would be hyperlinked to our future electromagnetic spectrum (ems) module, to provide a closer look at the mechanics of ems.

It can also be hyperlinked to already designed modules that parallel atomic representations of elements with their energetic pictures on the electromagnetic spectrum—in a way to satisfy the app’s ‘streamlining’ of multiple layers of knowledge.

Copyright © Louis Piper, Gökhan Ersan, SUNY, RF SUNY / 2017, 2018, 2019, 2020.  All rights reserved.  These Materials Matter digital infographics may not be published, reproduced, displayed, modified or distributed without the express prior written permission of the copyright holder. For permission, contact [gersan@binghamton.edu]

mm2-02.png
mm2-03.png
mm2-04.png
mm2-05.png
mm2-06.png
mm2-07.png
mm2-08.png
mm2-10.png
mm2-09.png
mm2-11.png
mm2-12.png
mm2-13.png
mm2-14.png
mm2-15.jpg

materials matter app module (2017) cross-referenced periodic table

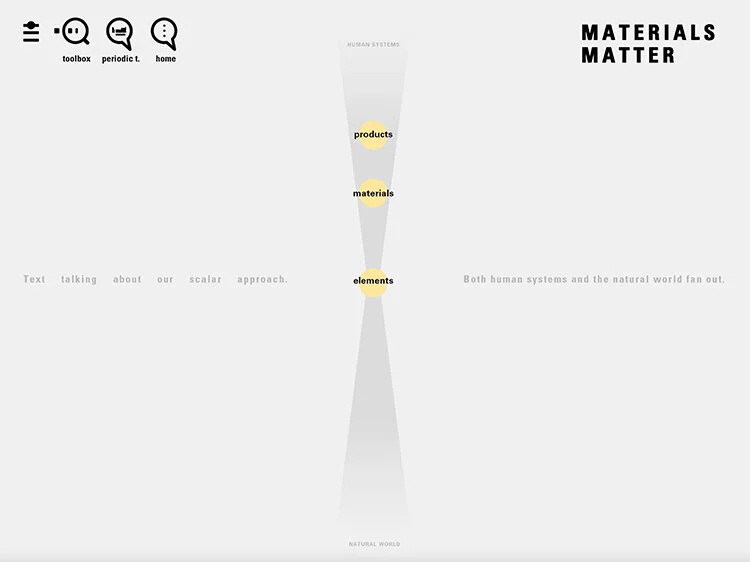
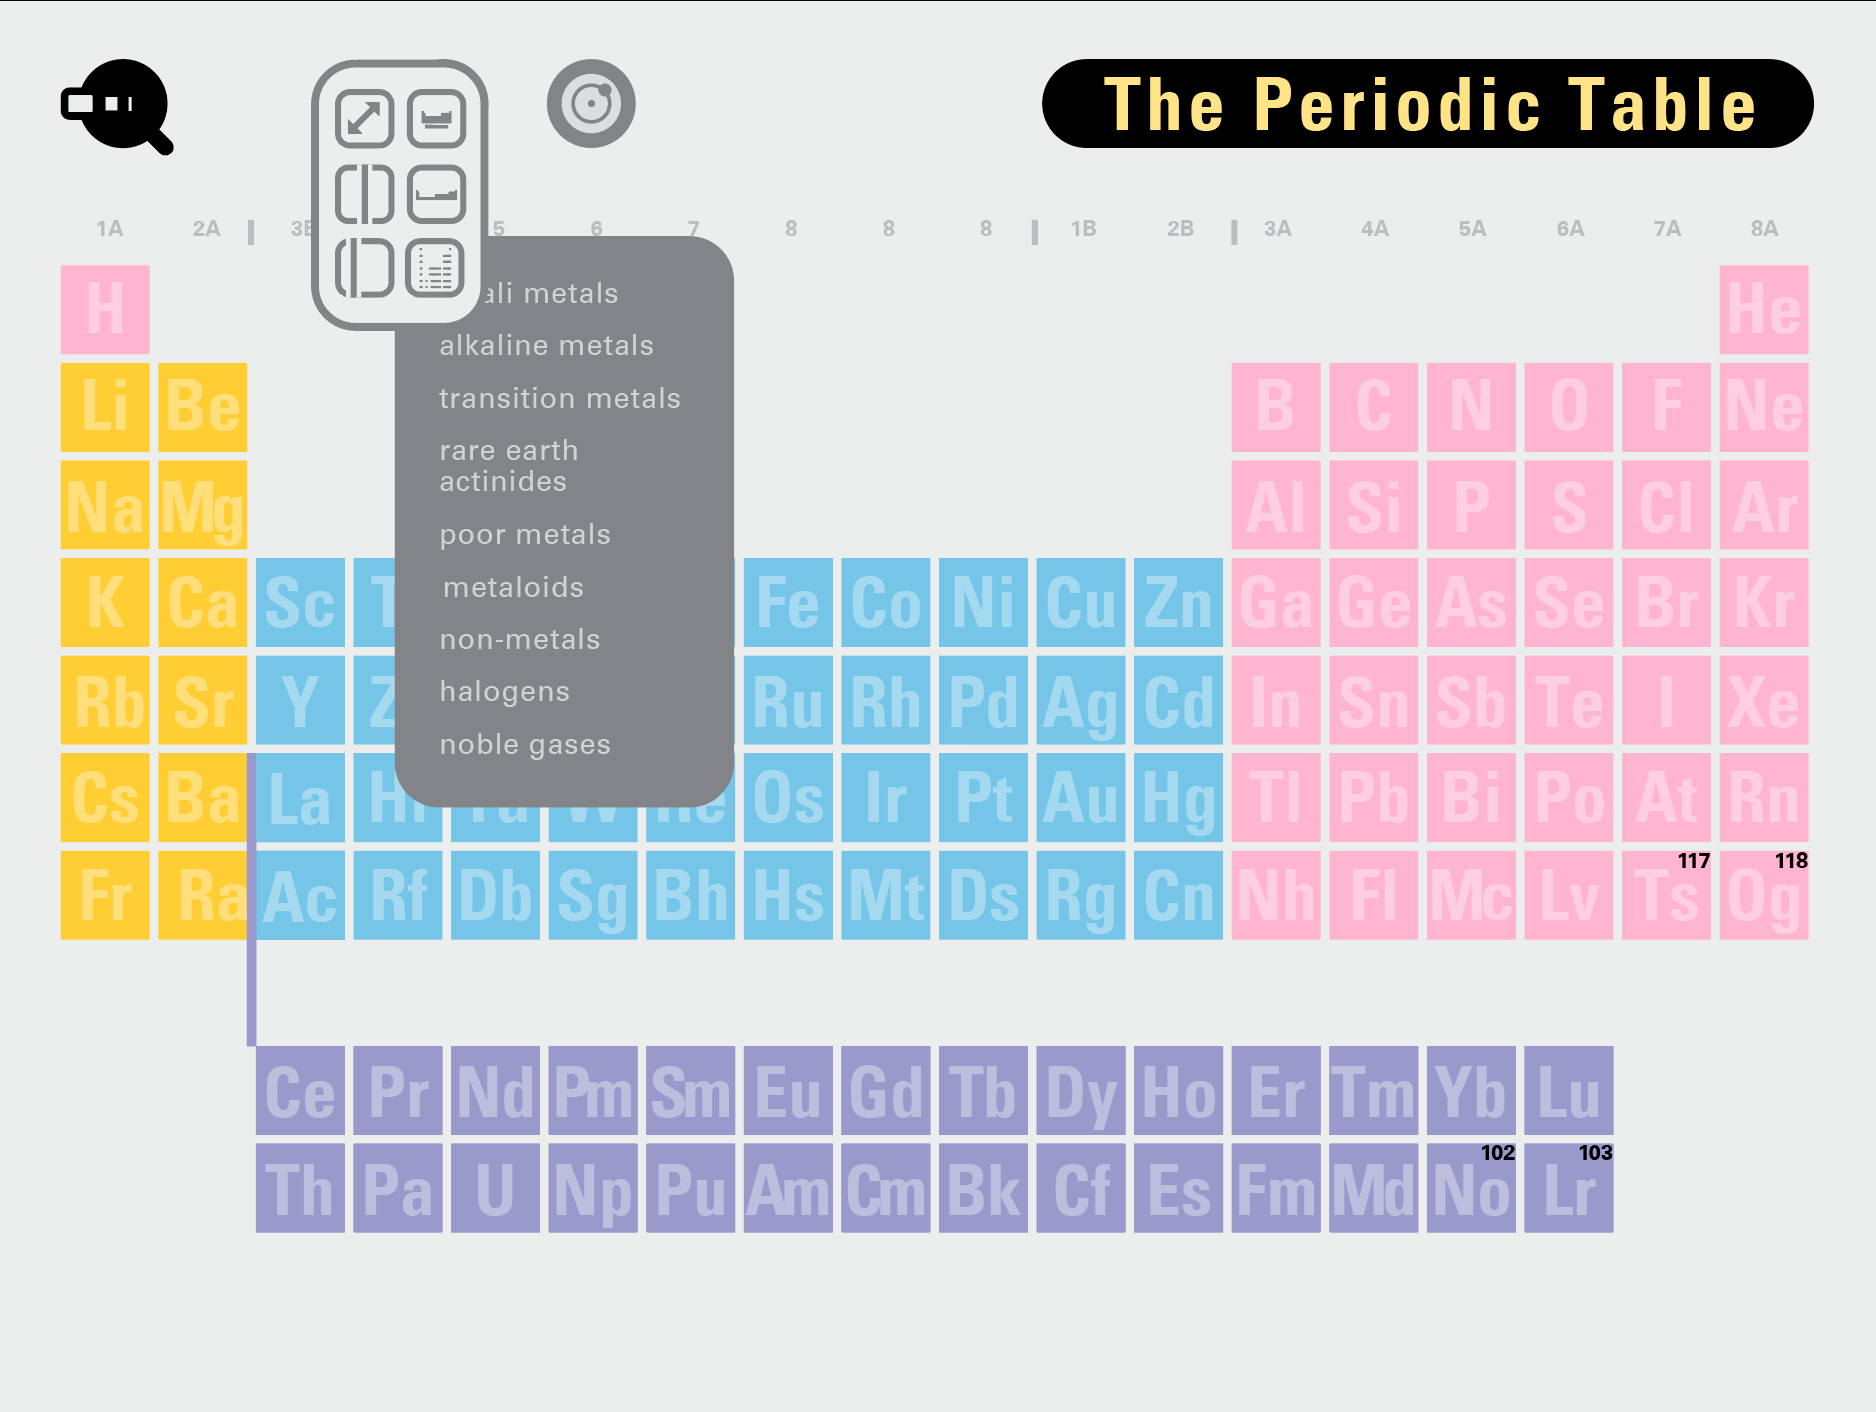
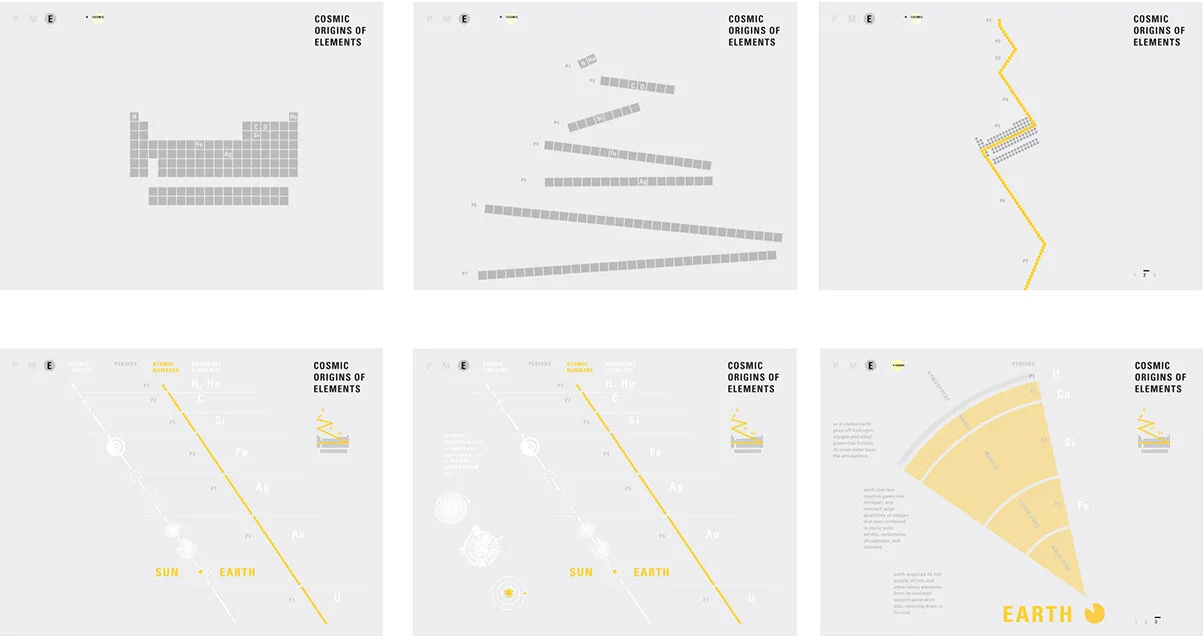
With this module we aim to make the periodic table more legible. Our design is drawing graphical connections between the rows of the periodic table and the energy levels and orbital models of the corresponding elements.

The Cross-referenced Periodic Table came out of our design research sessions that took place at Binghamton University physics labs in 2017. This module was a collaboration between me (art and design), Hilary Becker (classical archaeologist, BU), and a physics team led by Louis Piper that featured research assistants Todd Rutkowski and Matt Wahila. Software engineer Faizaan Khan is implementing a database-driven and browser-accessible version of this module.

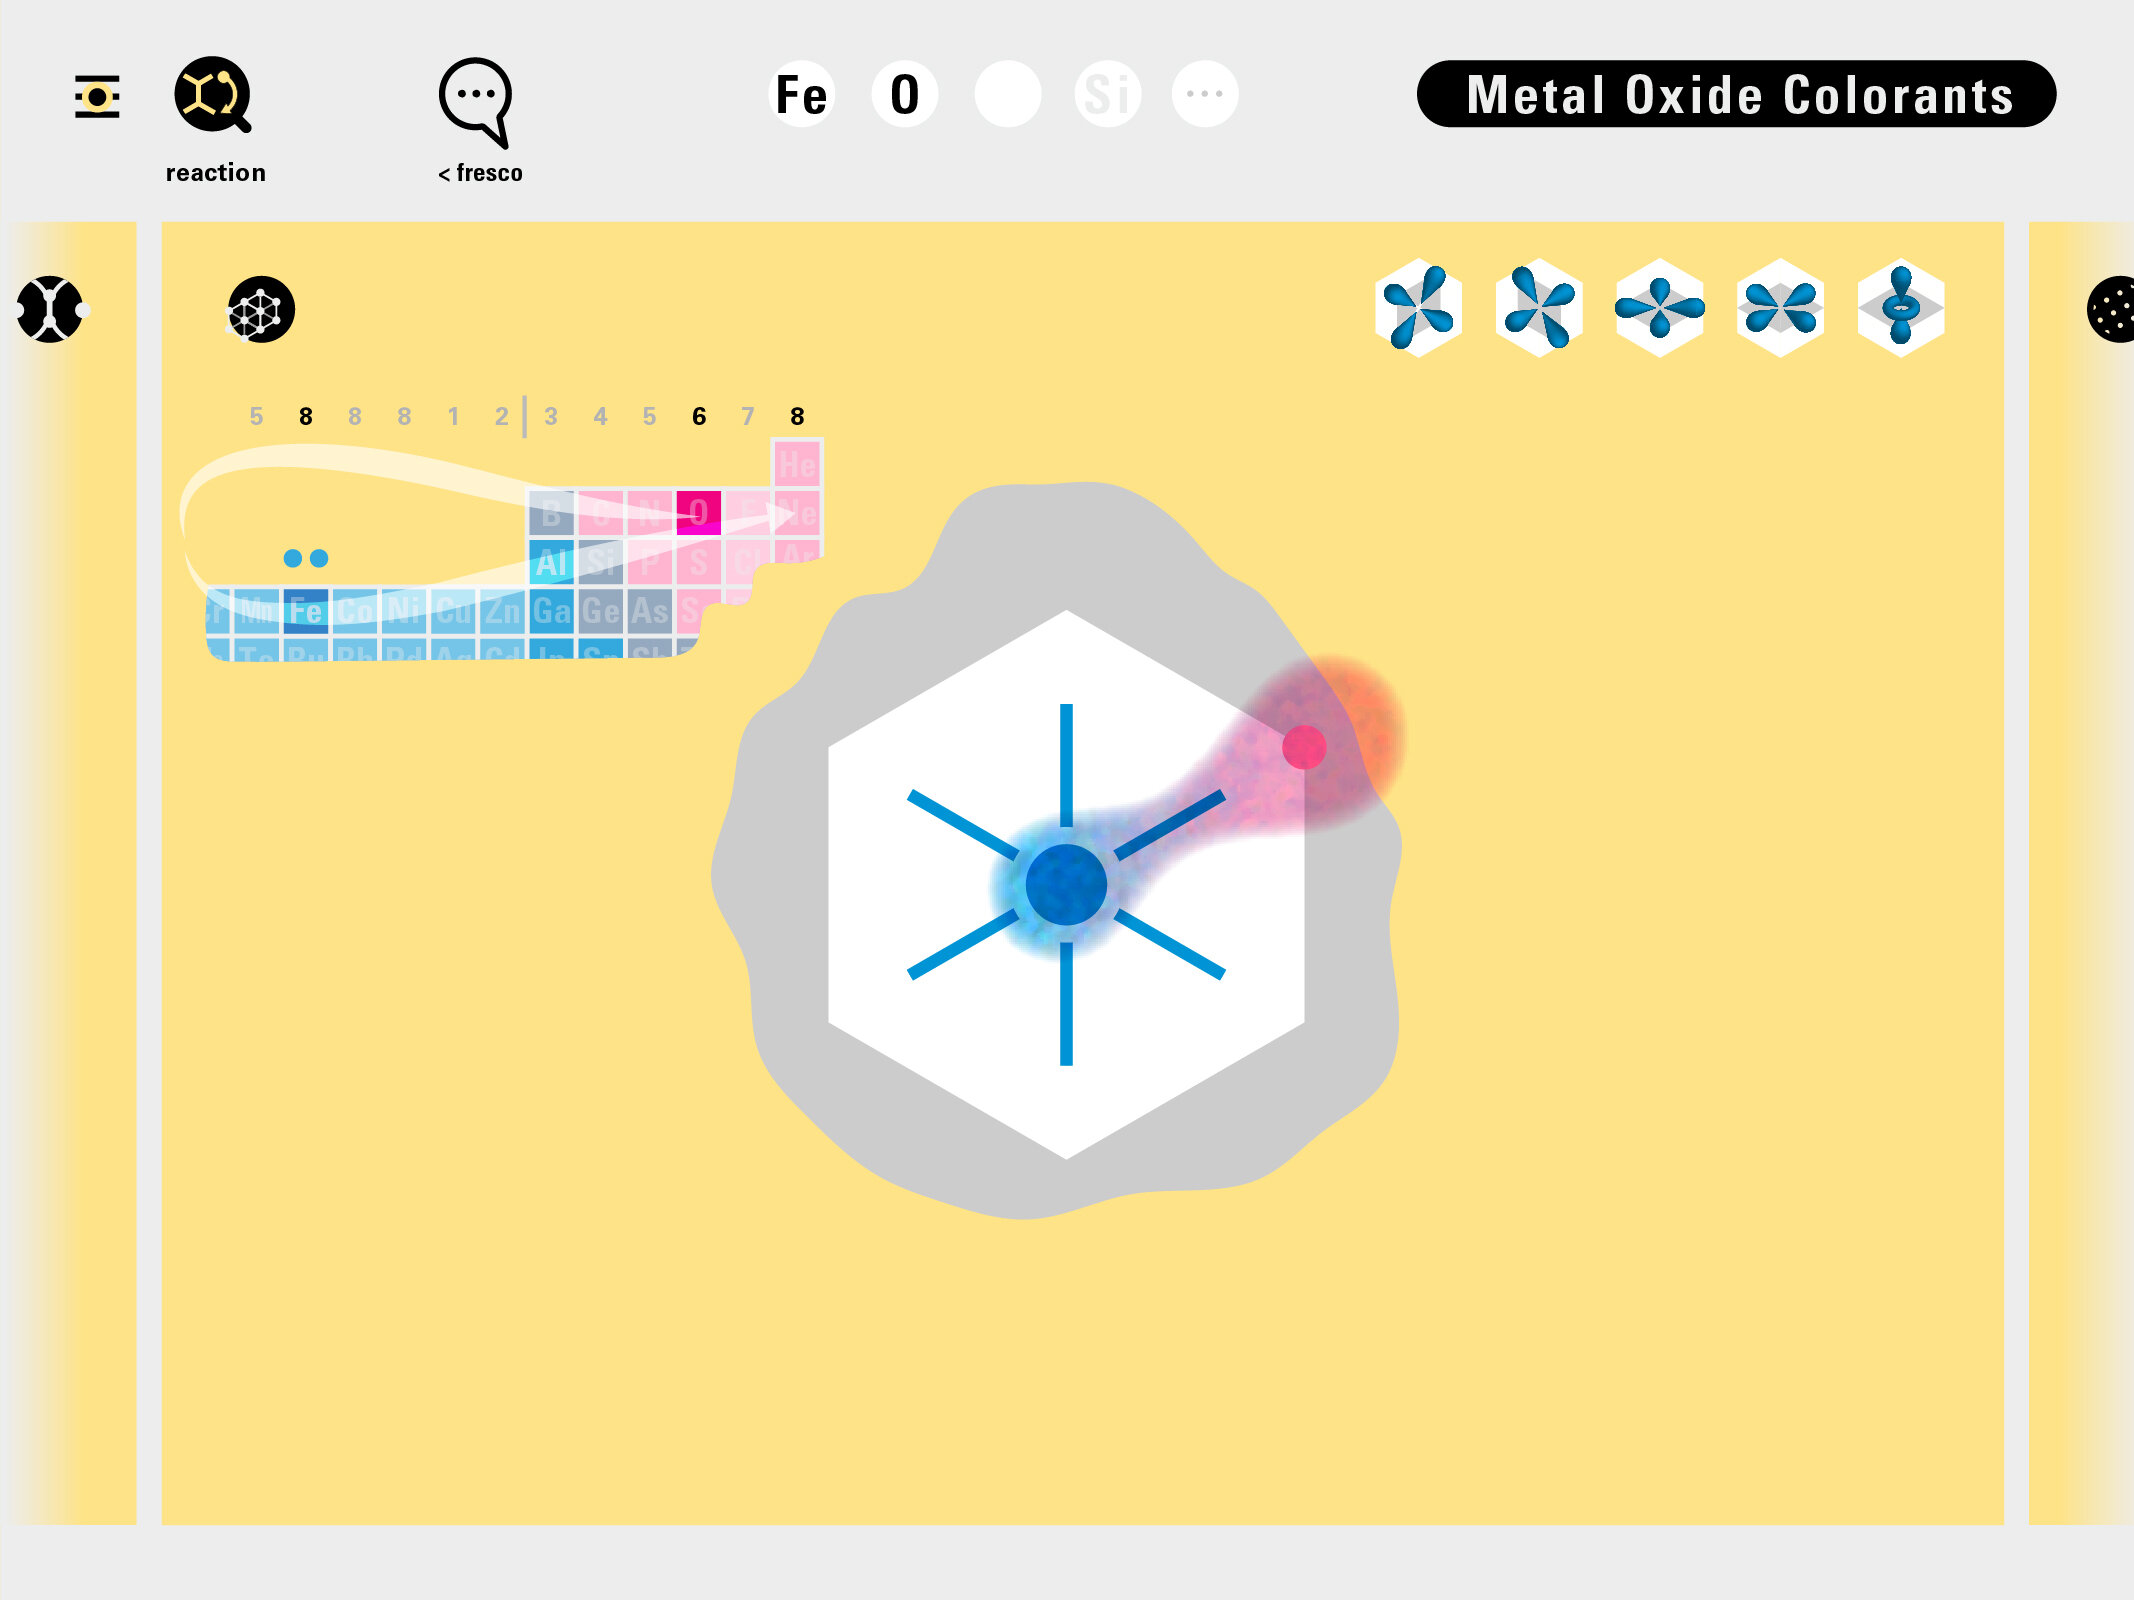
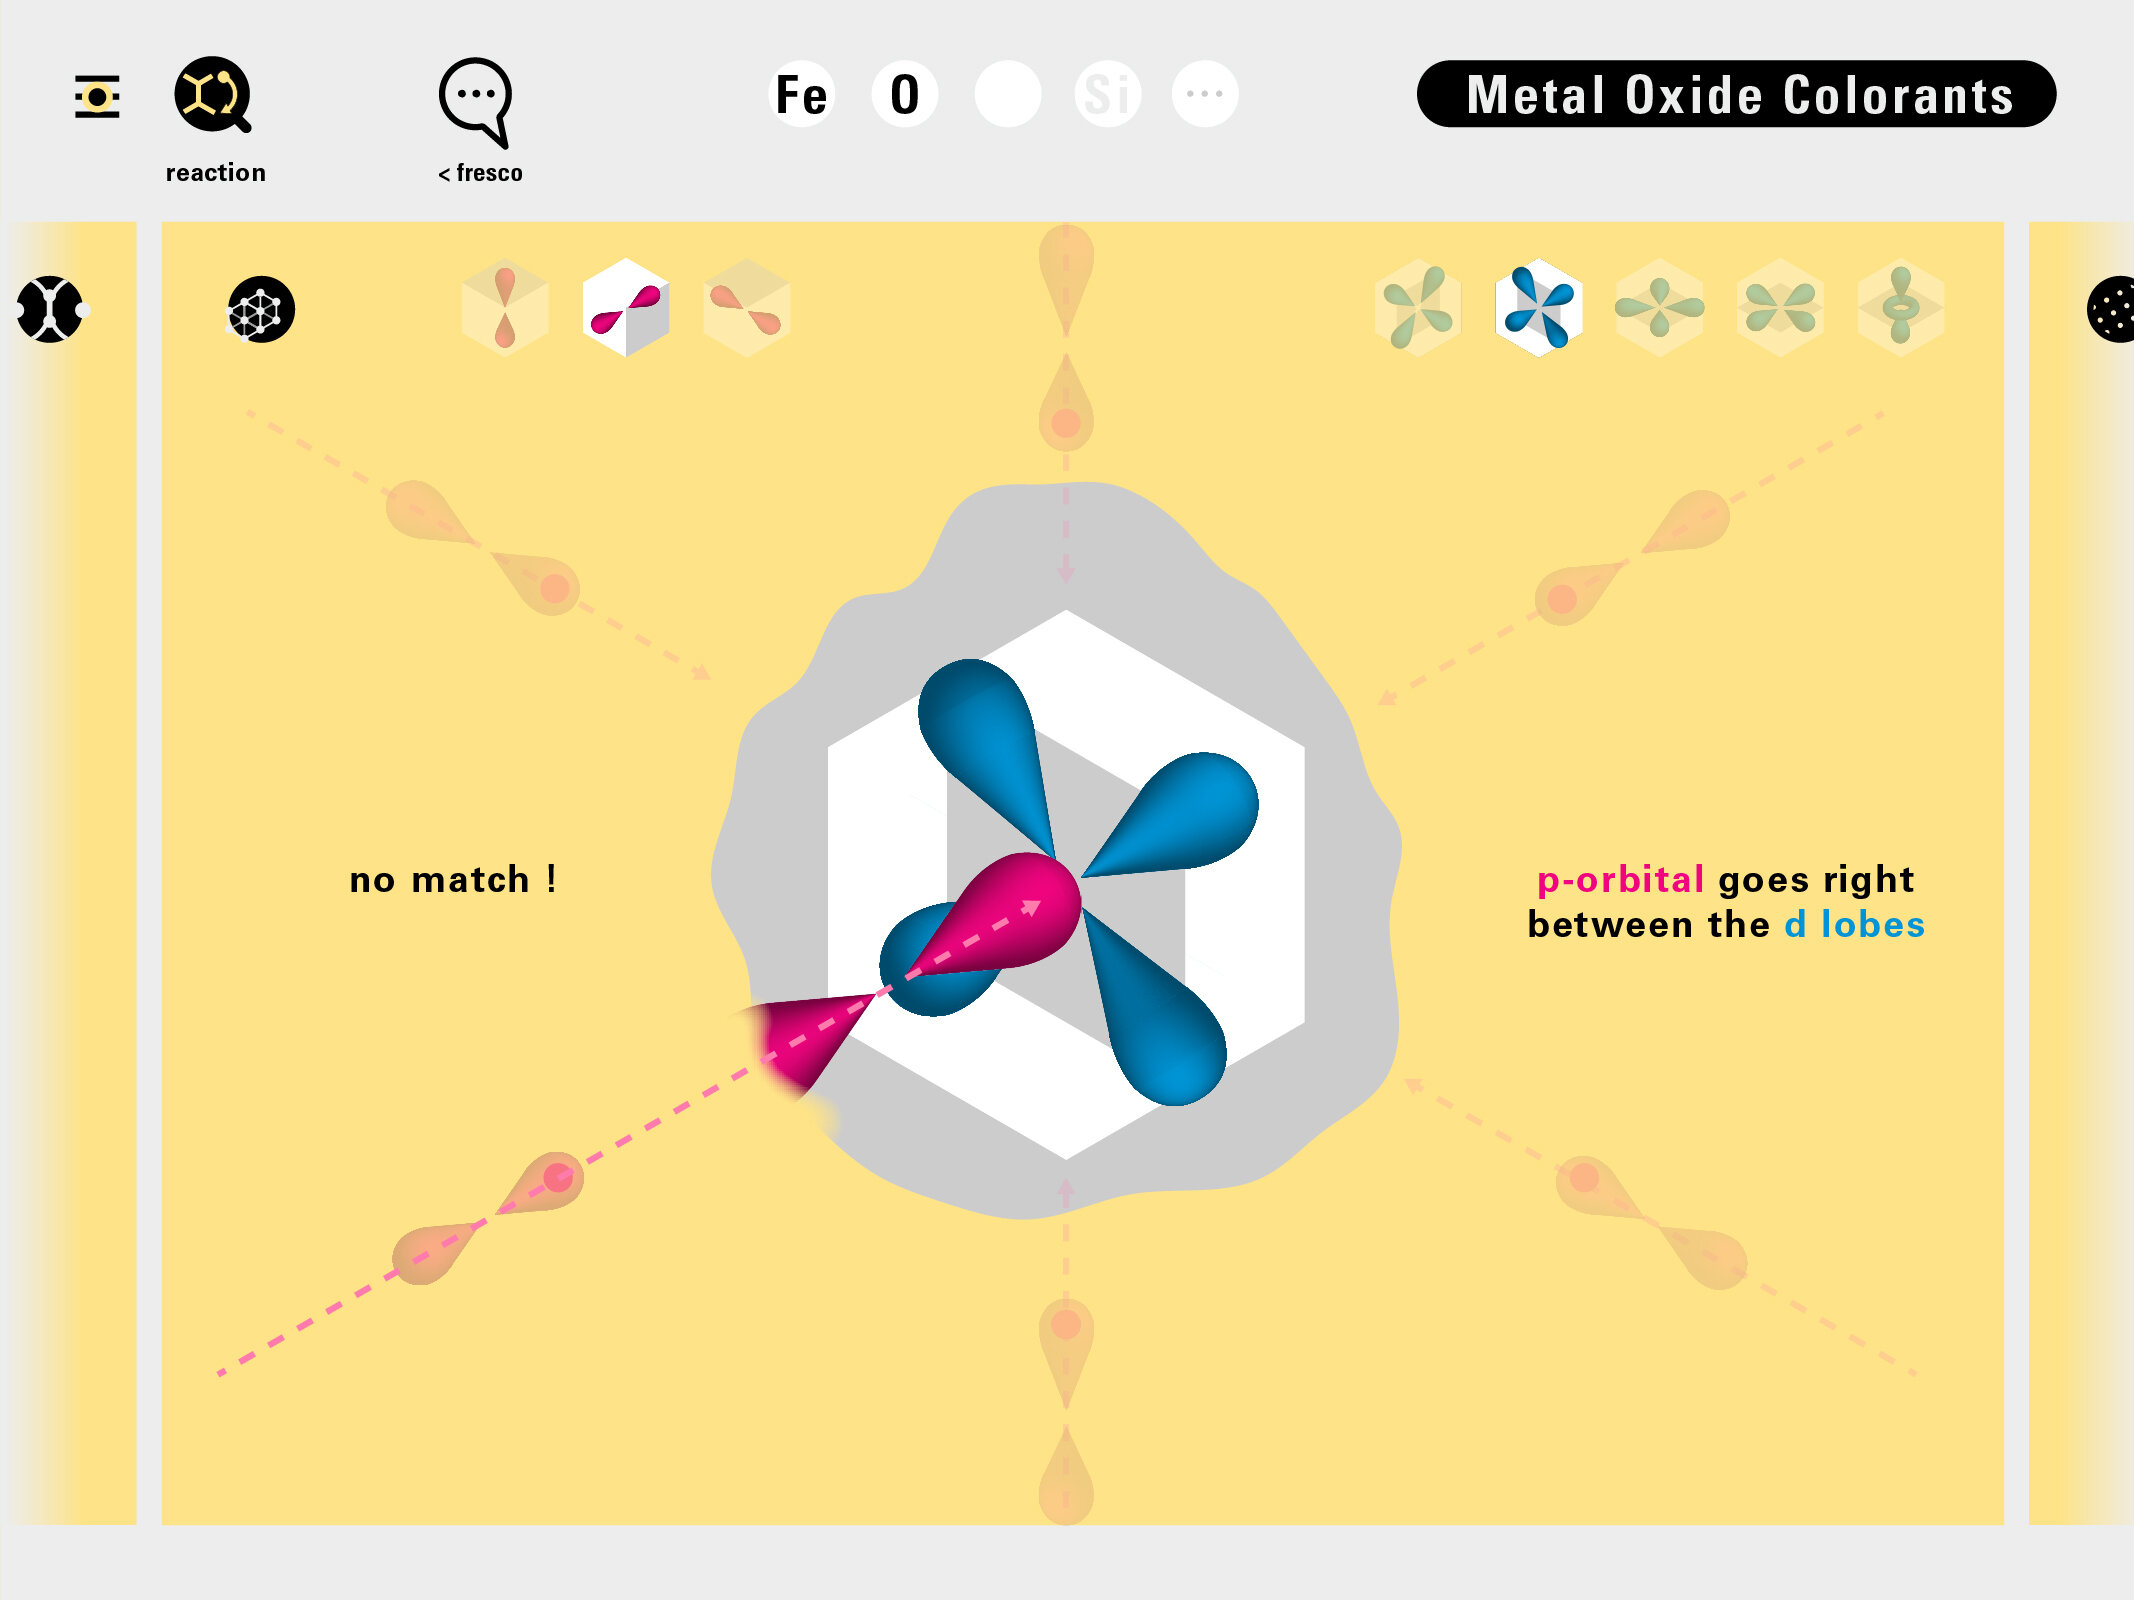
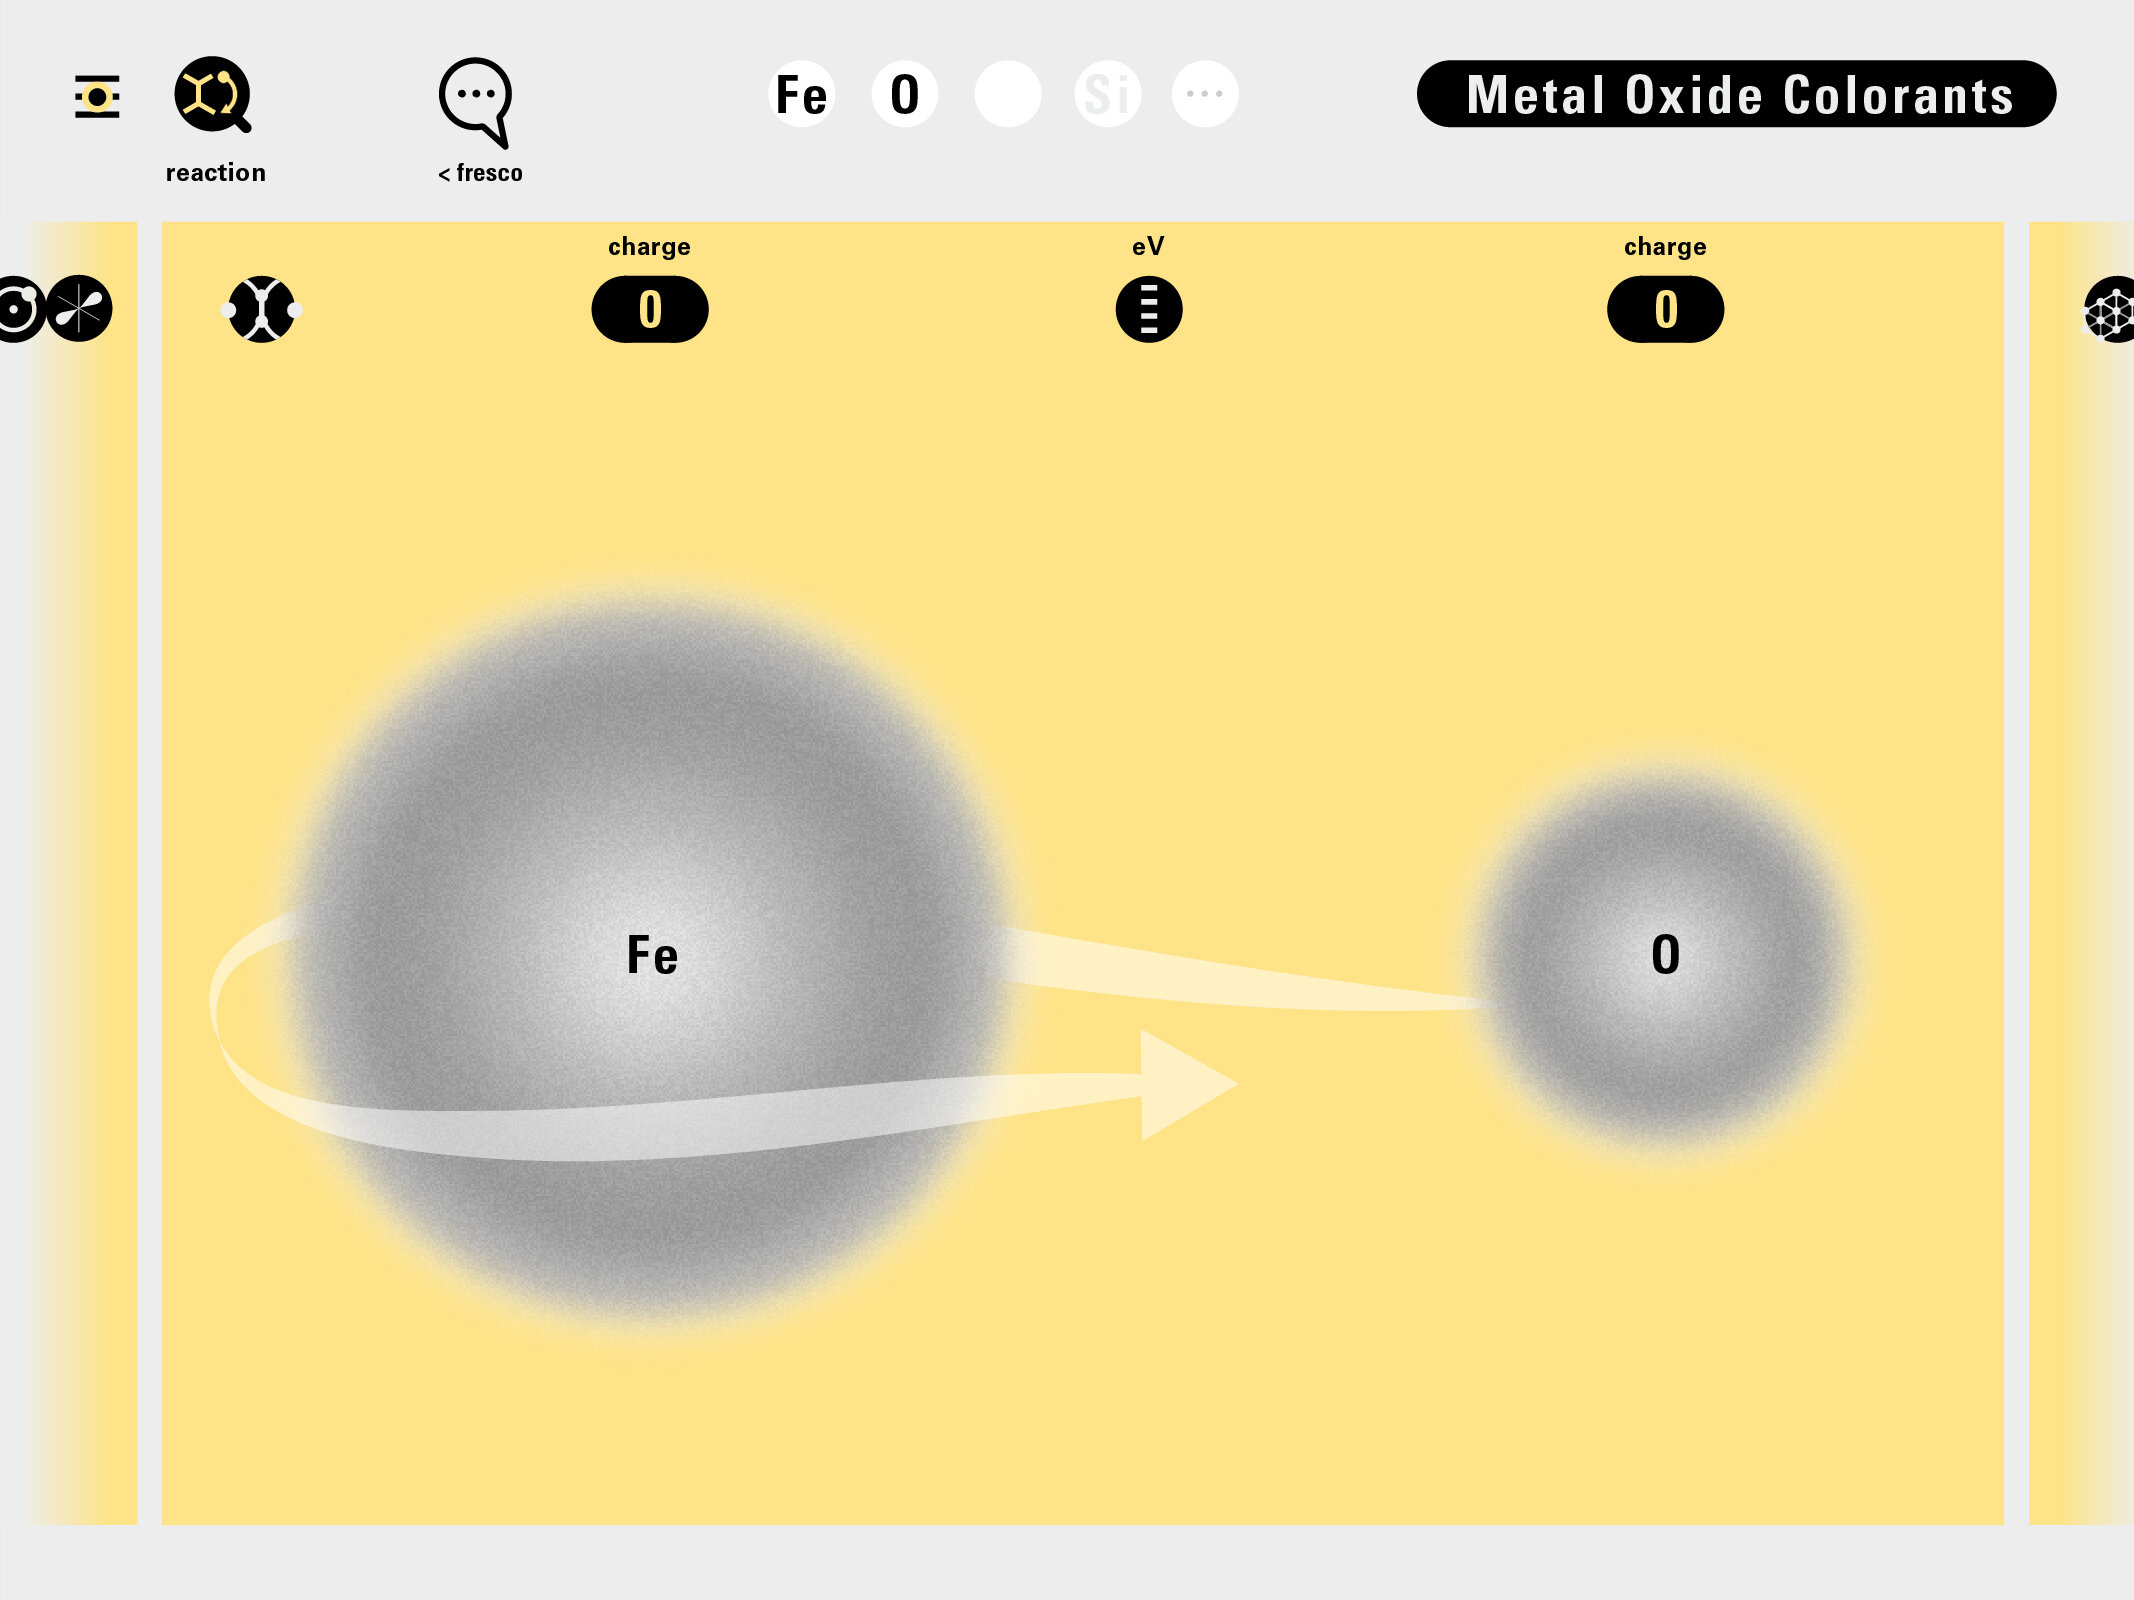
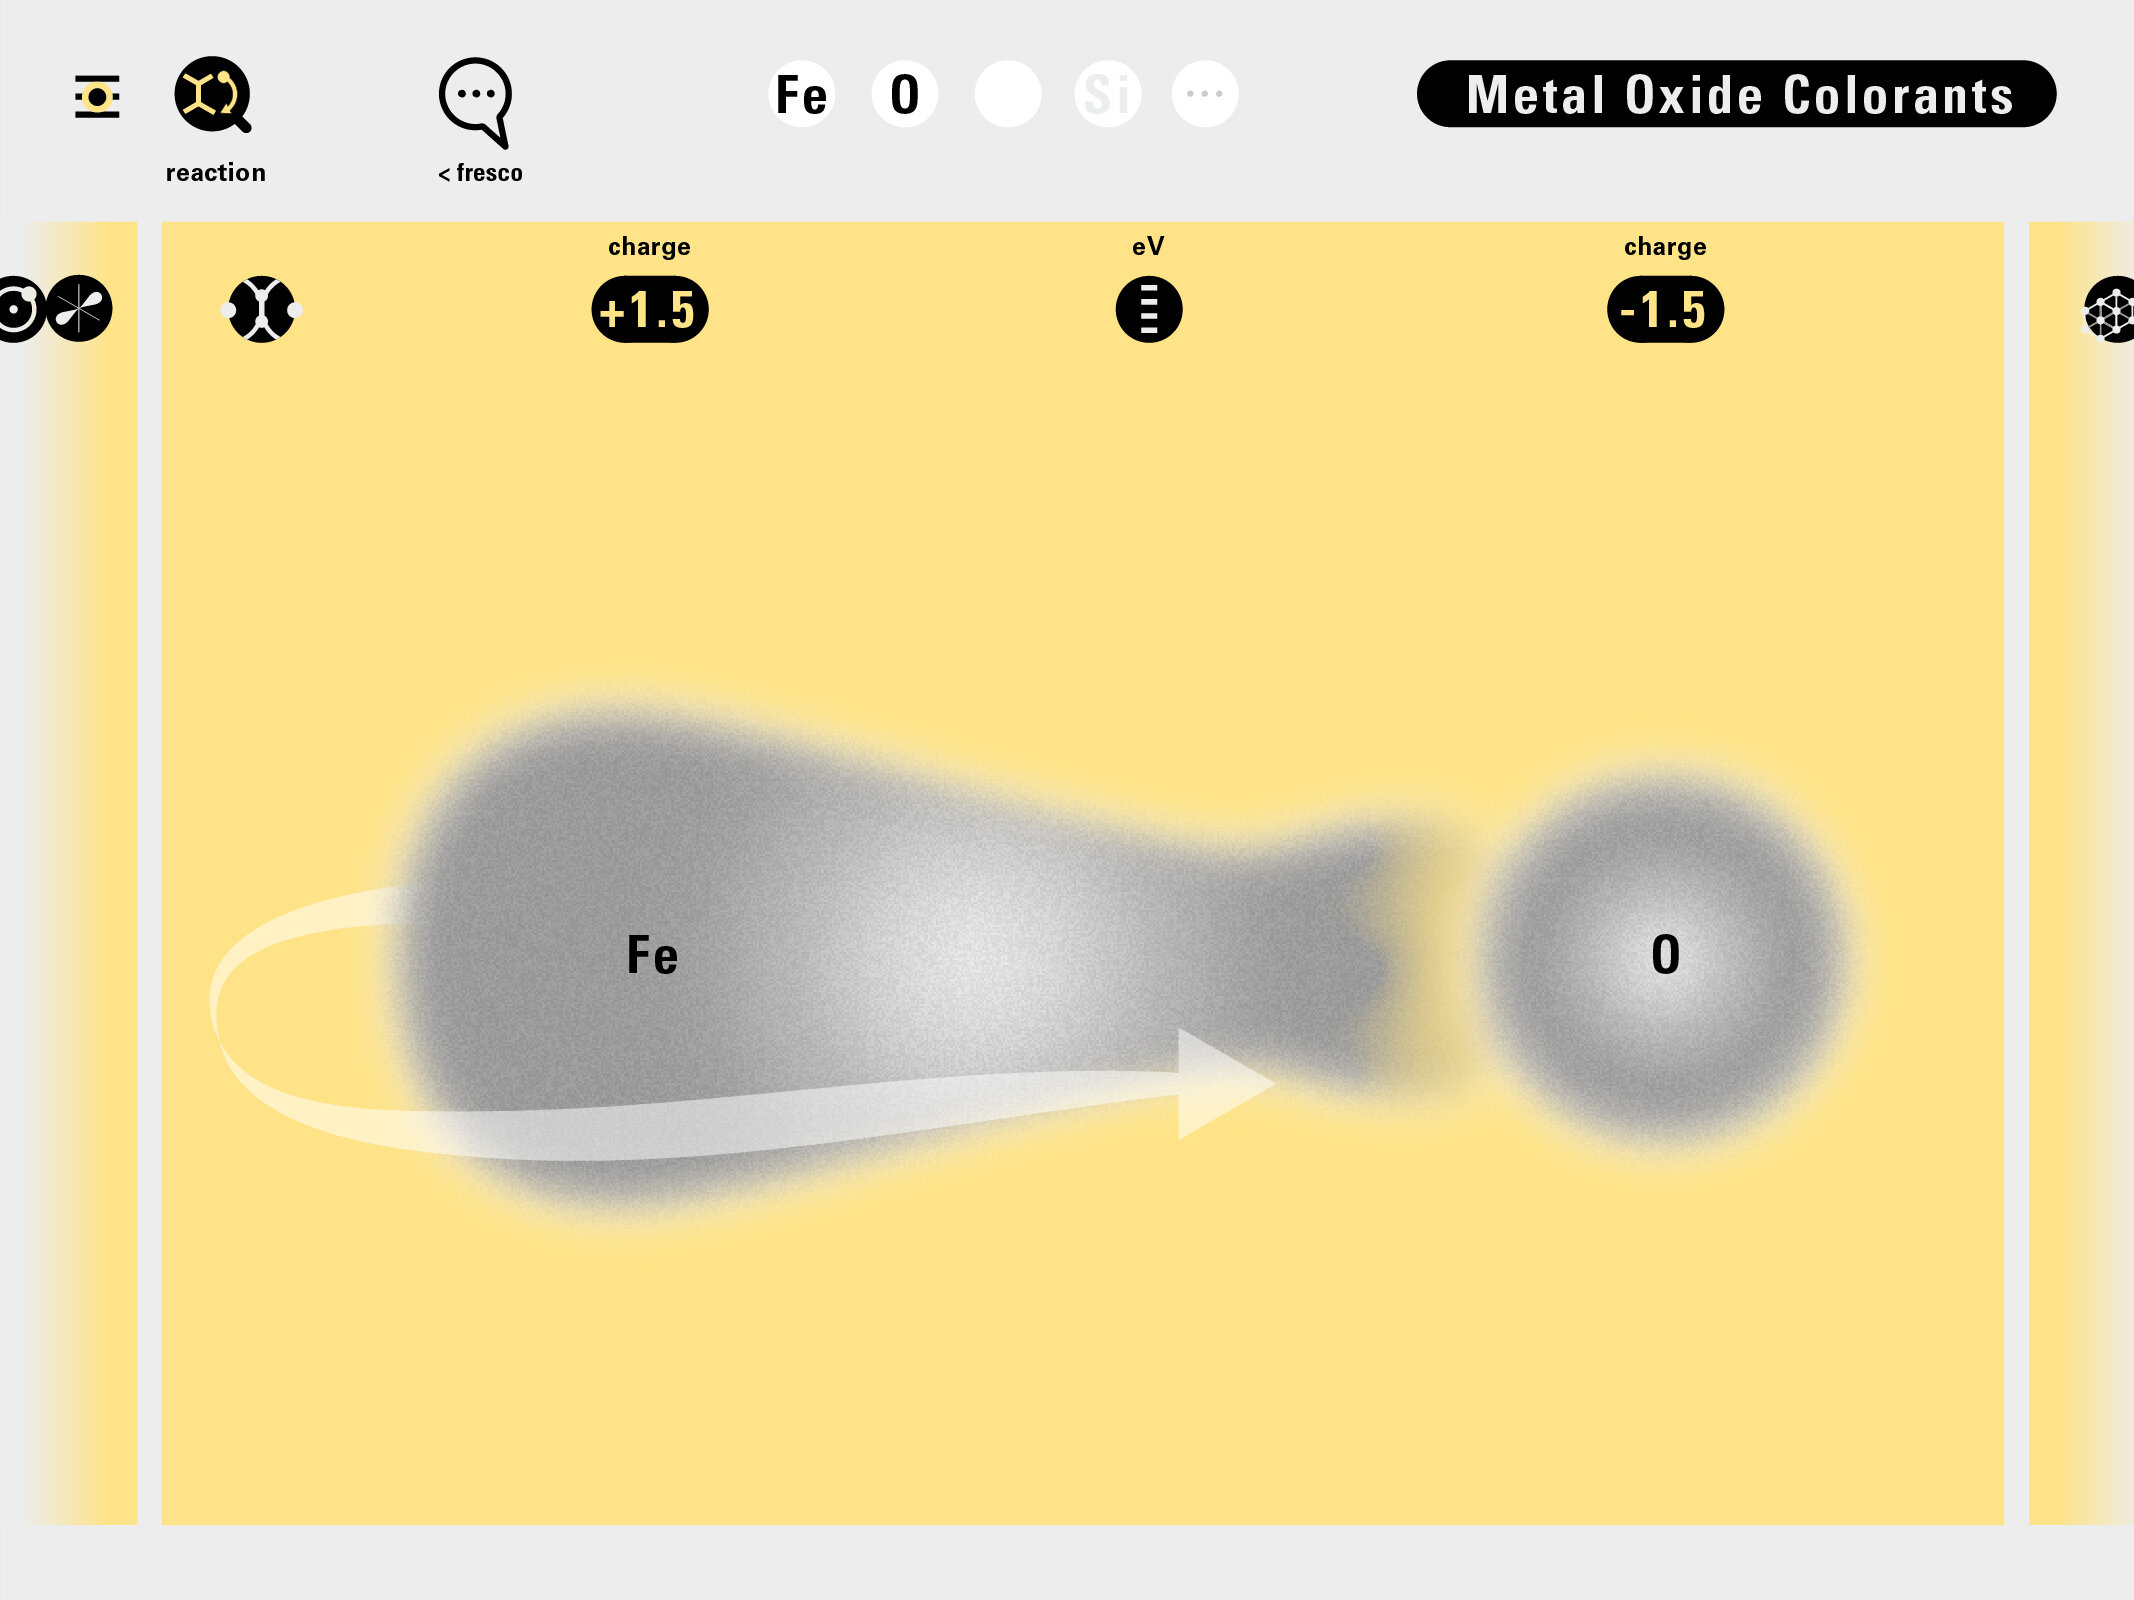
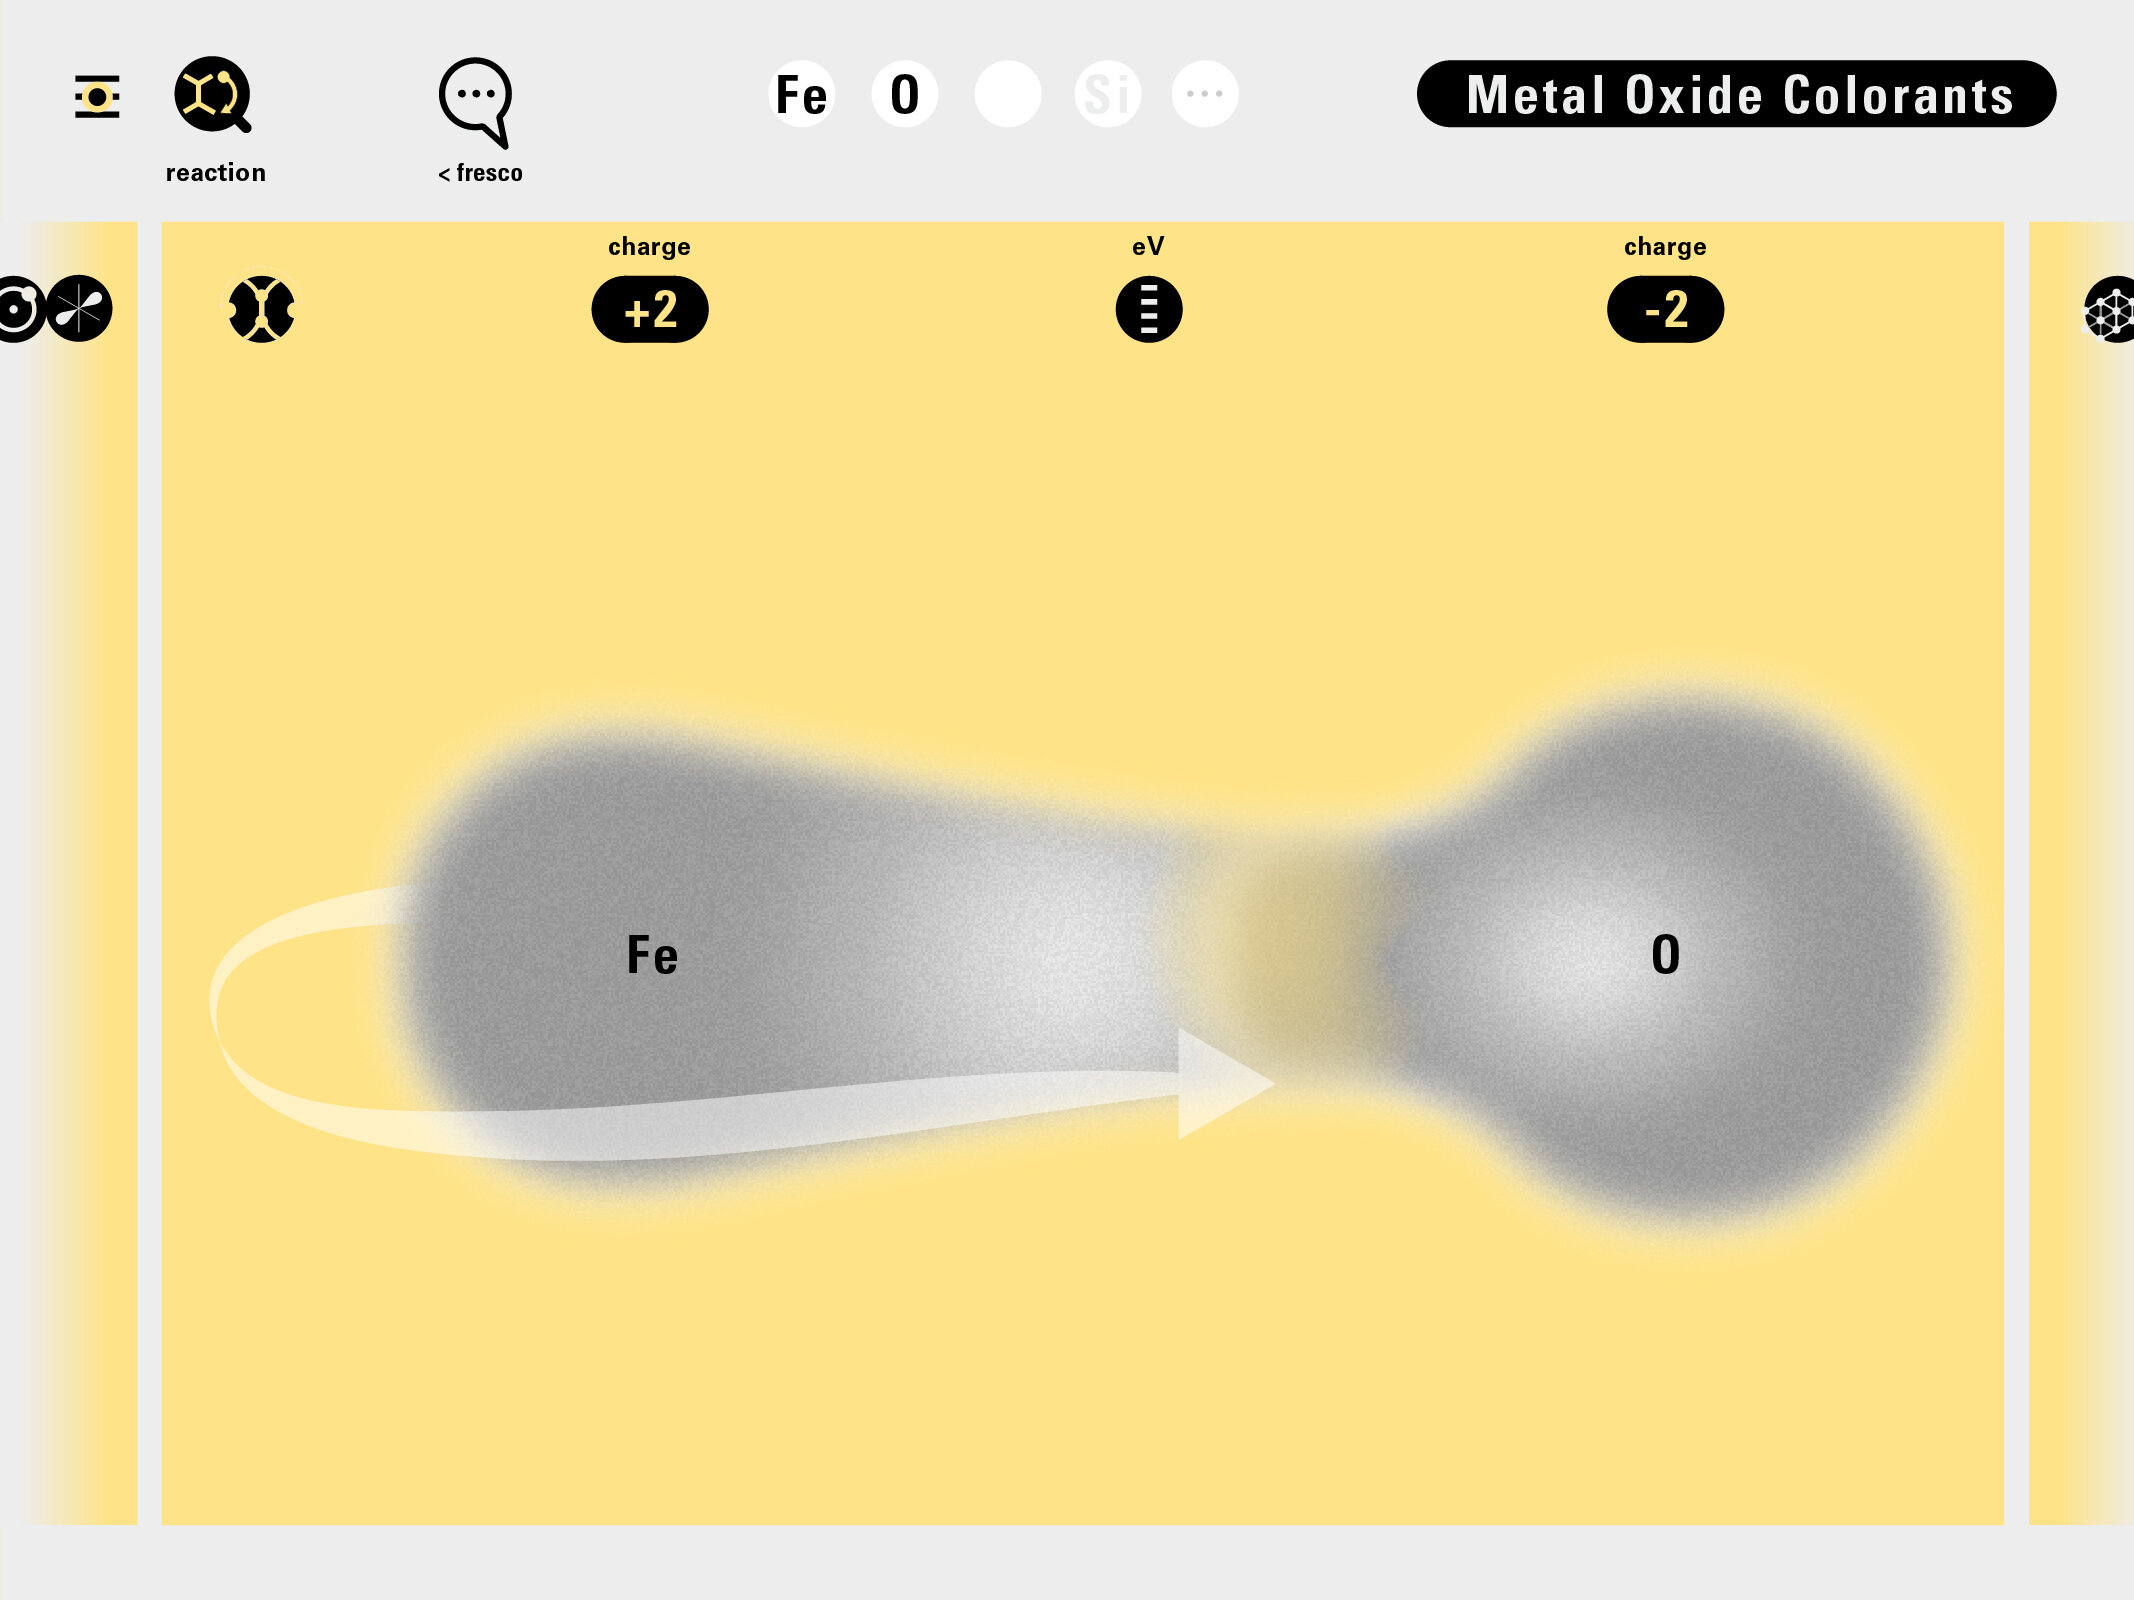
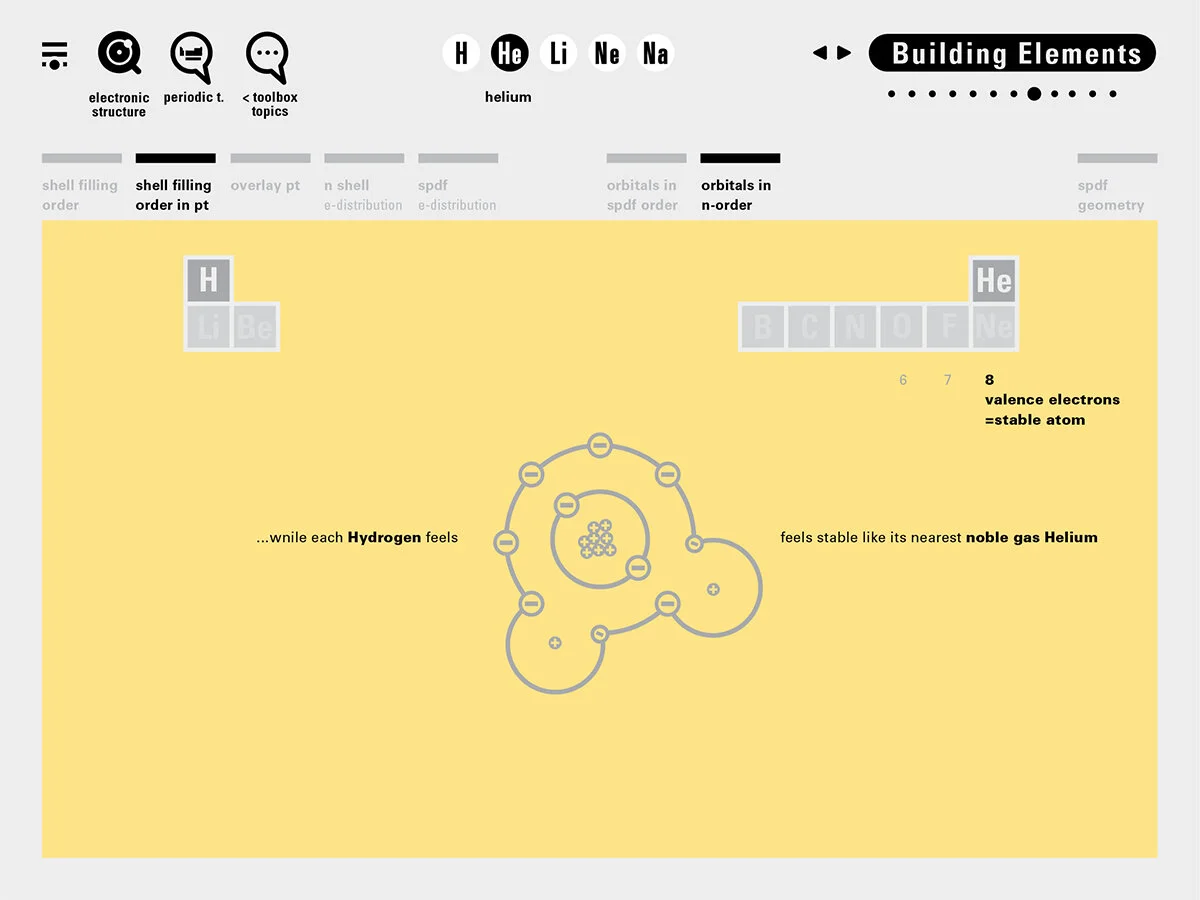
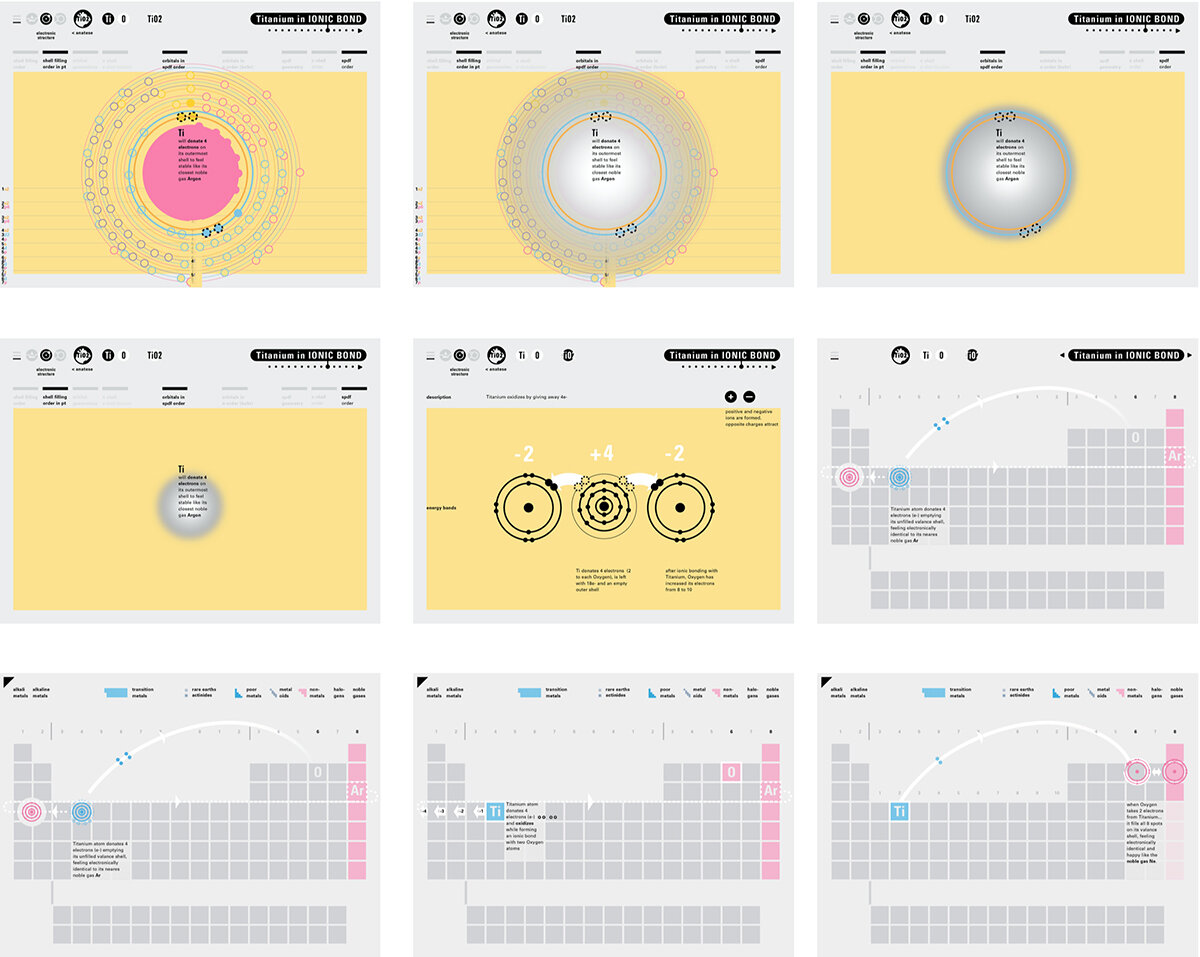
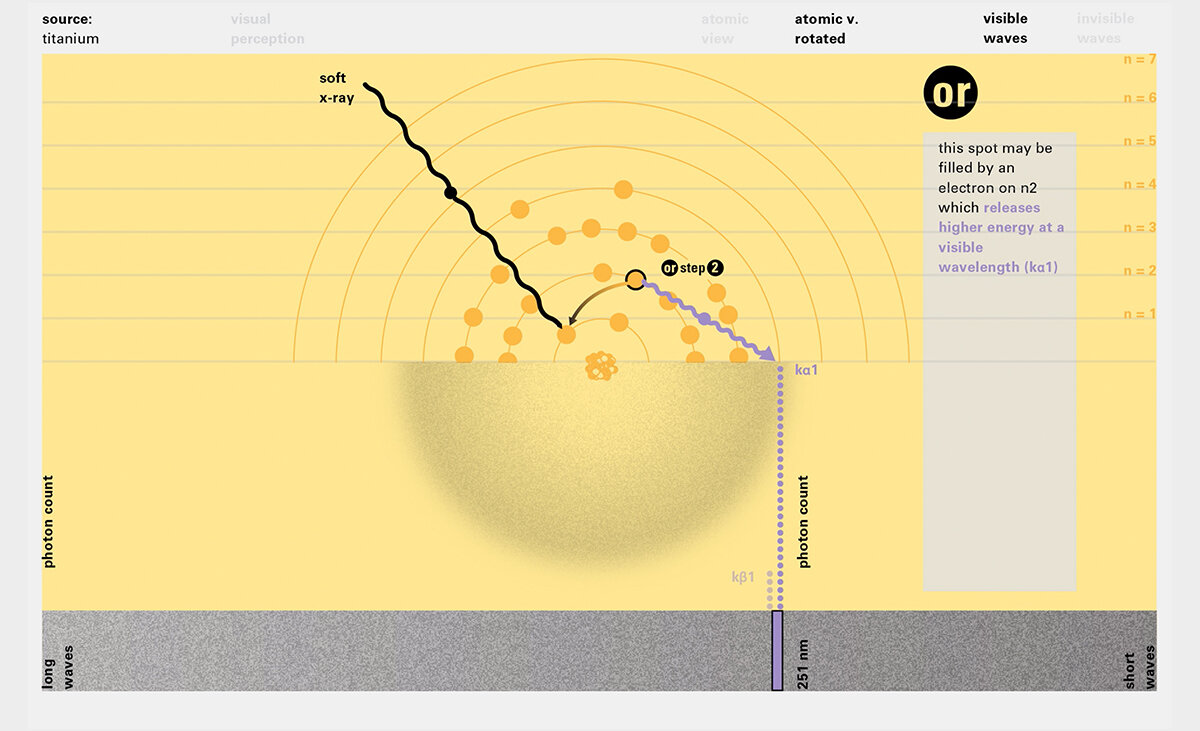
Louis Piper outlined a strategy for a design that would utilize periodic table’s rows and columns to tell the story of elements. Dr. Piper envisioned the last column of the periodic table to serve as its ‘spine.’ This last column would feature elements that are stable in electronic structure by virtue of possessing 8 electrons on their bond-forming outer shells. This view would encourage viewers to perform ‘electron counting’ in order to help them predict how two elements on the periodic table would bond.

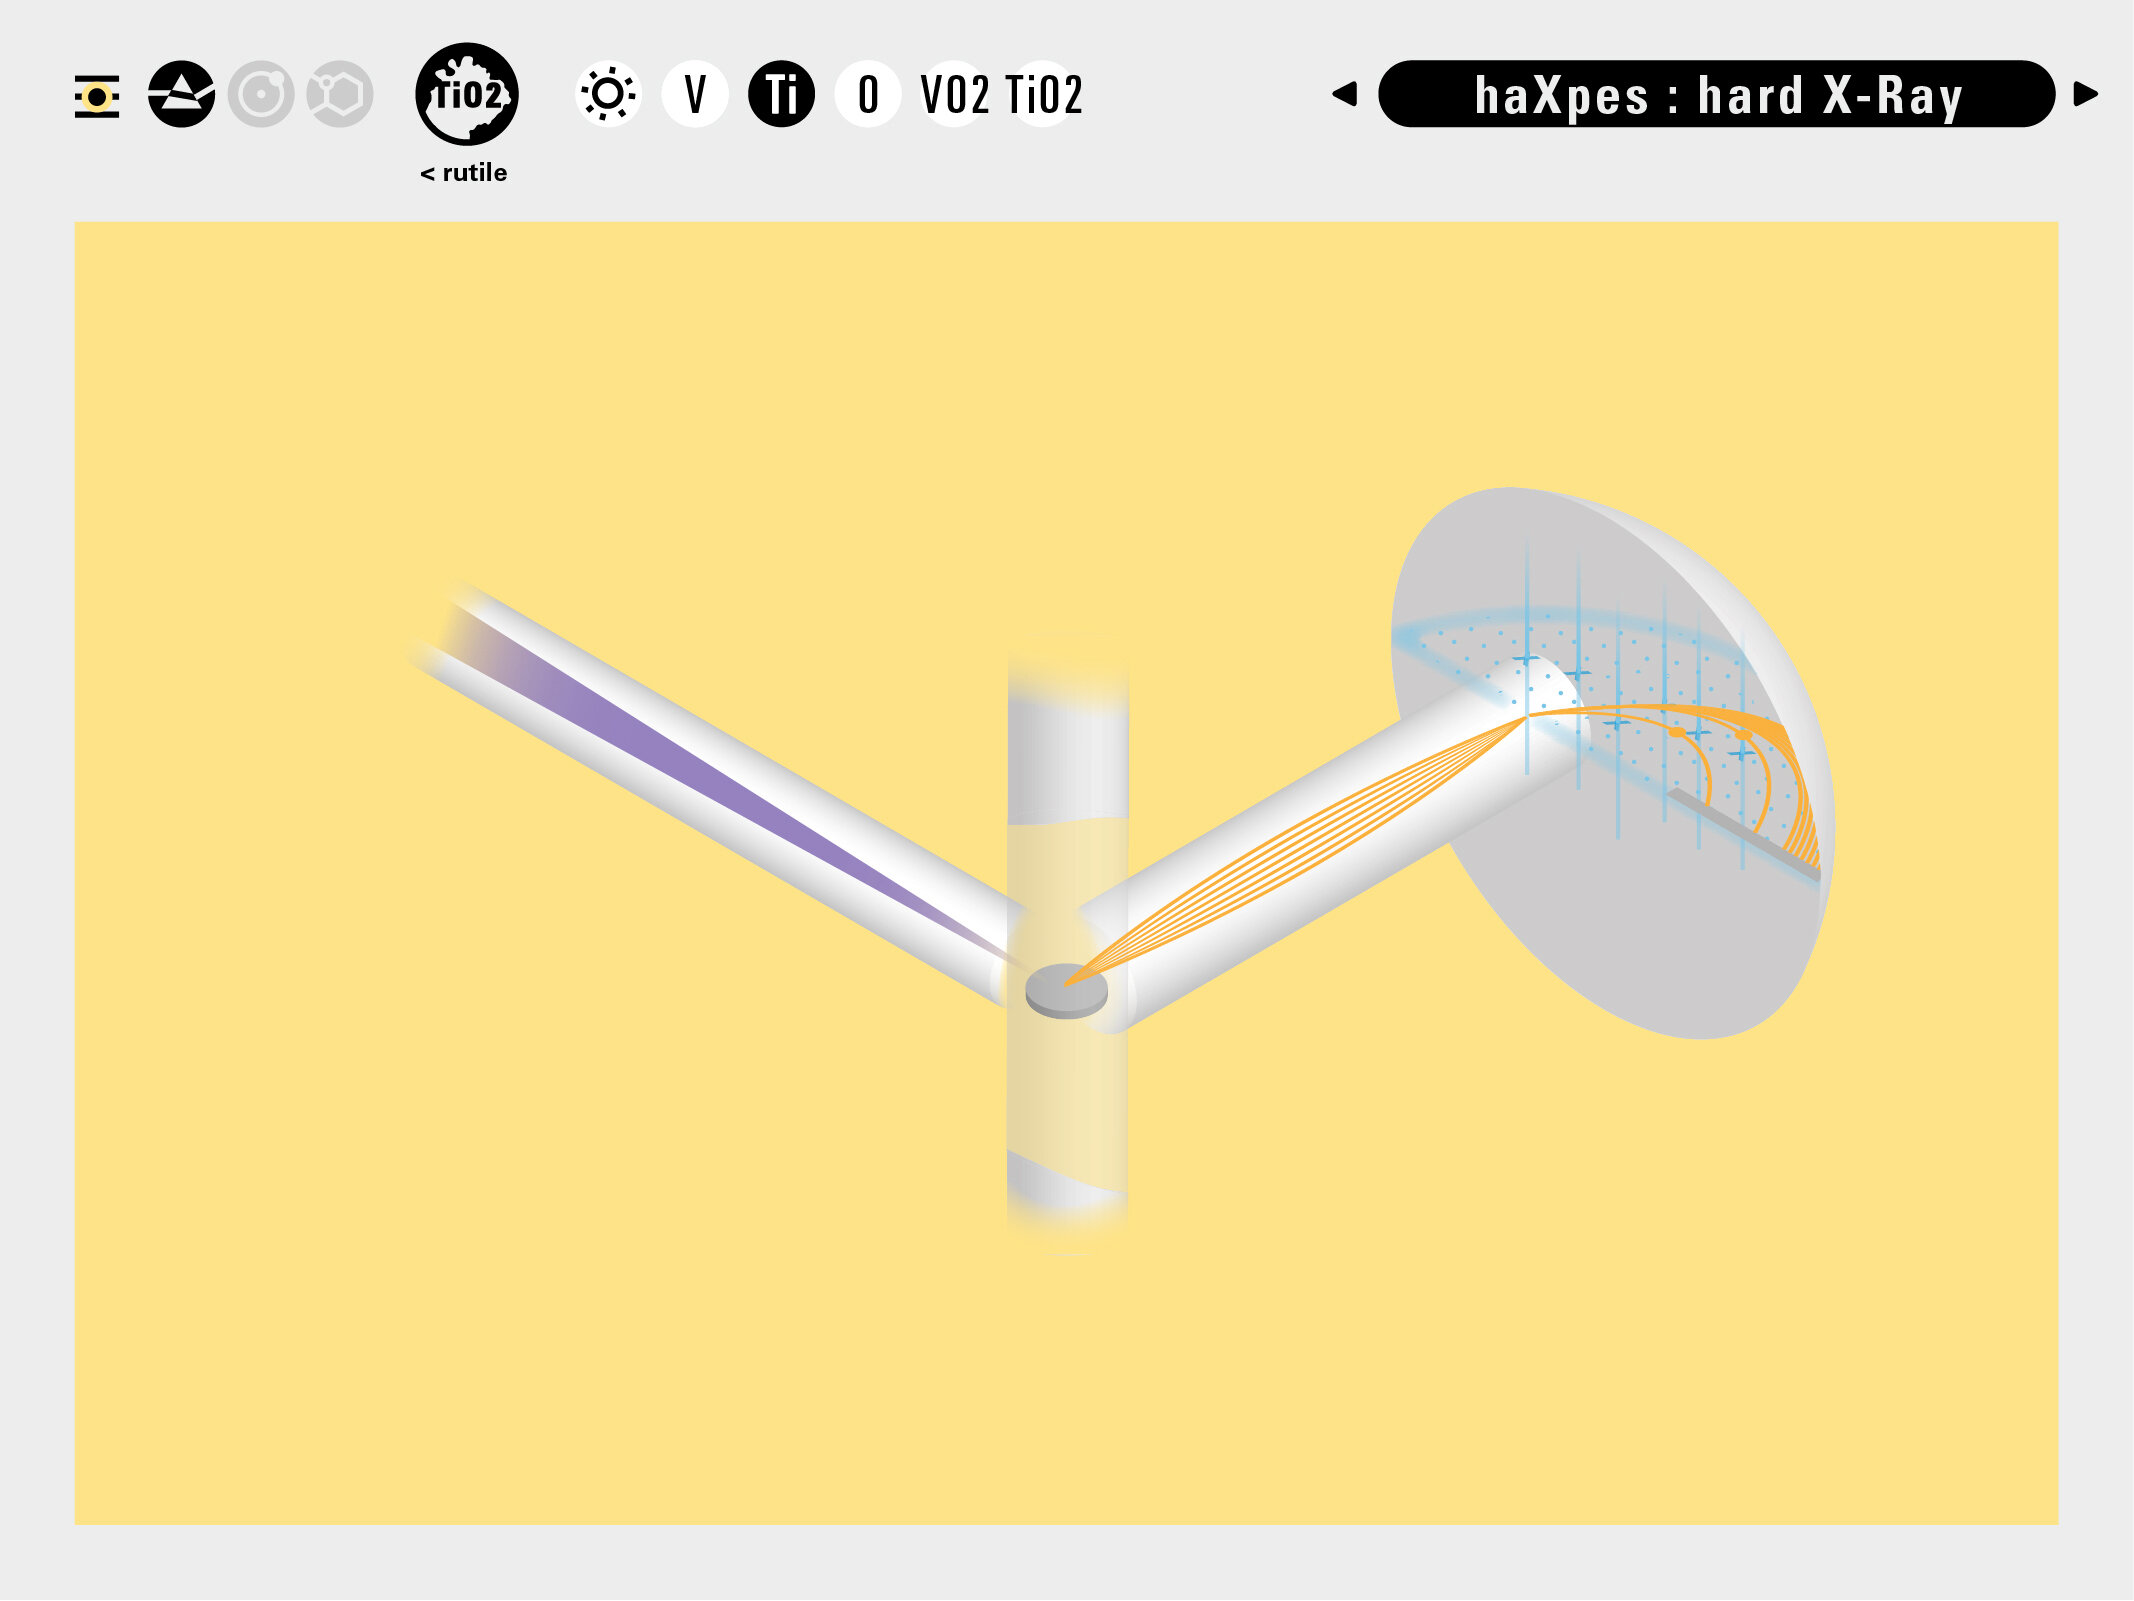
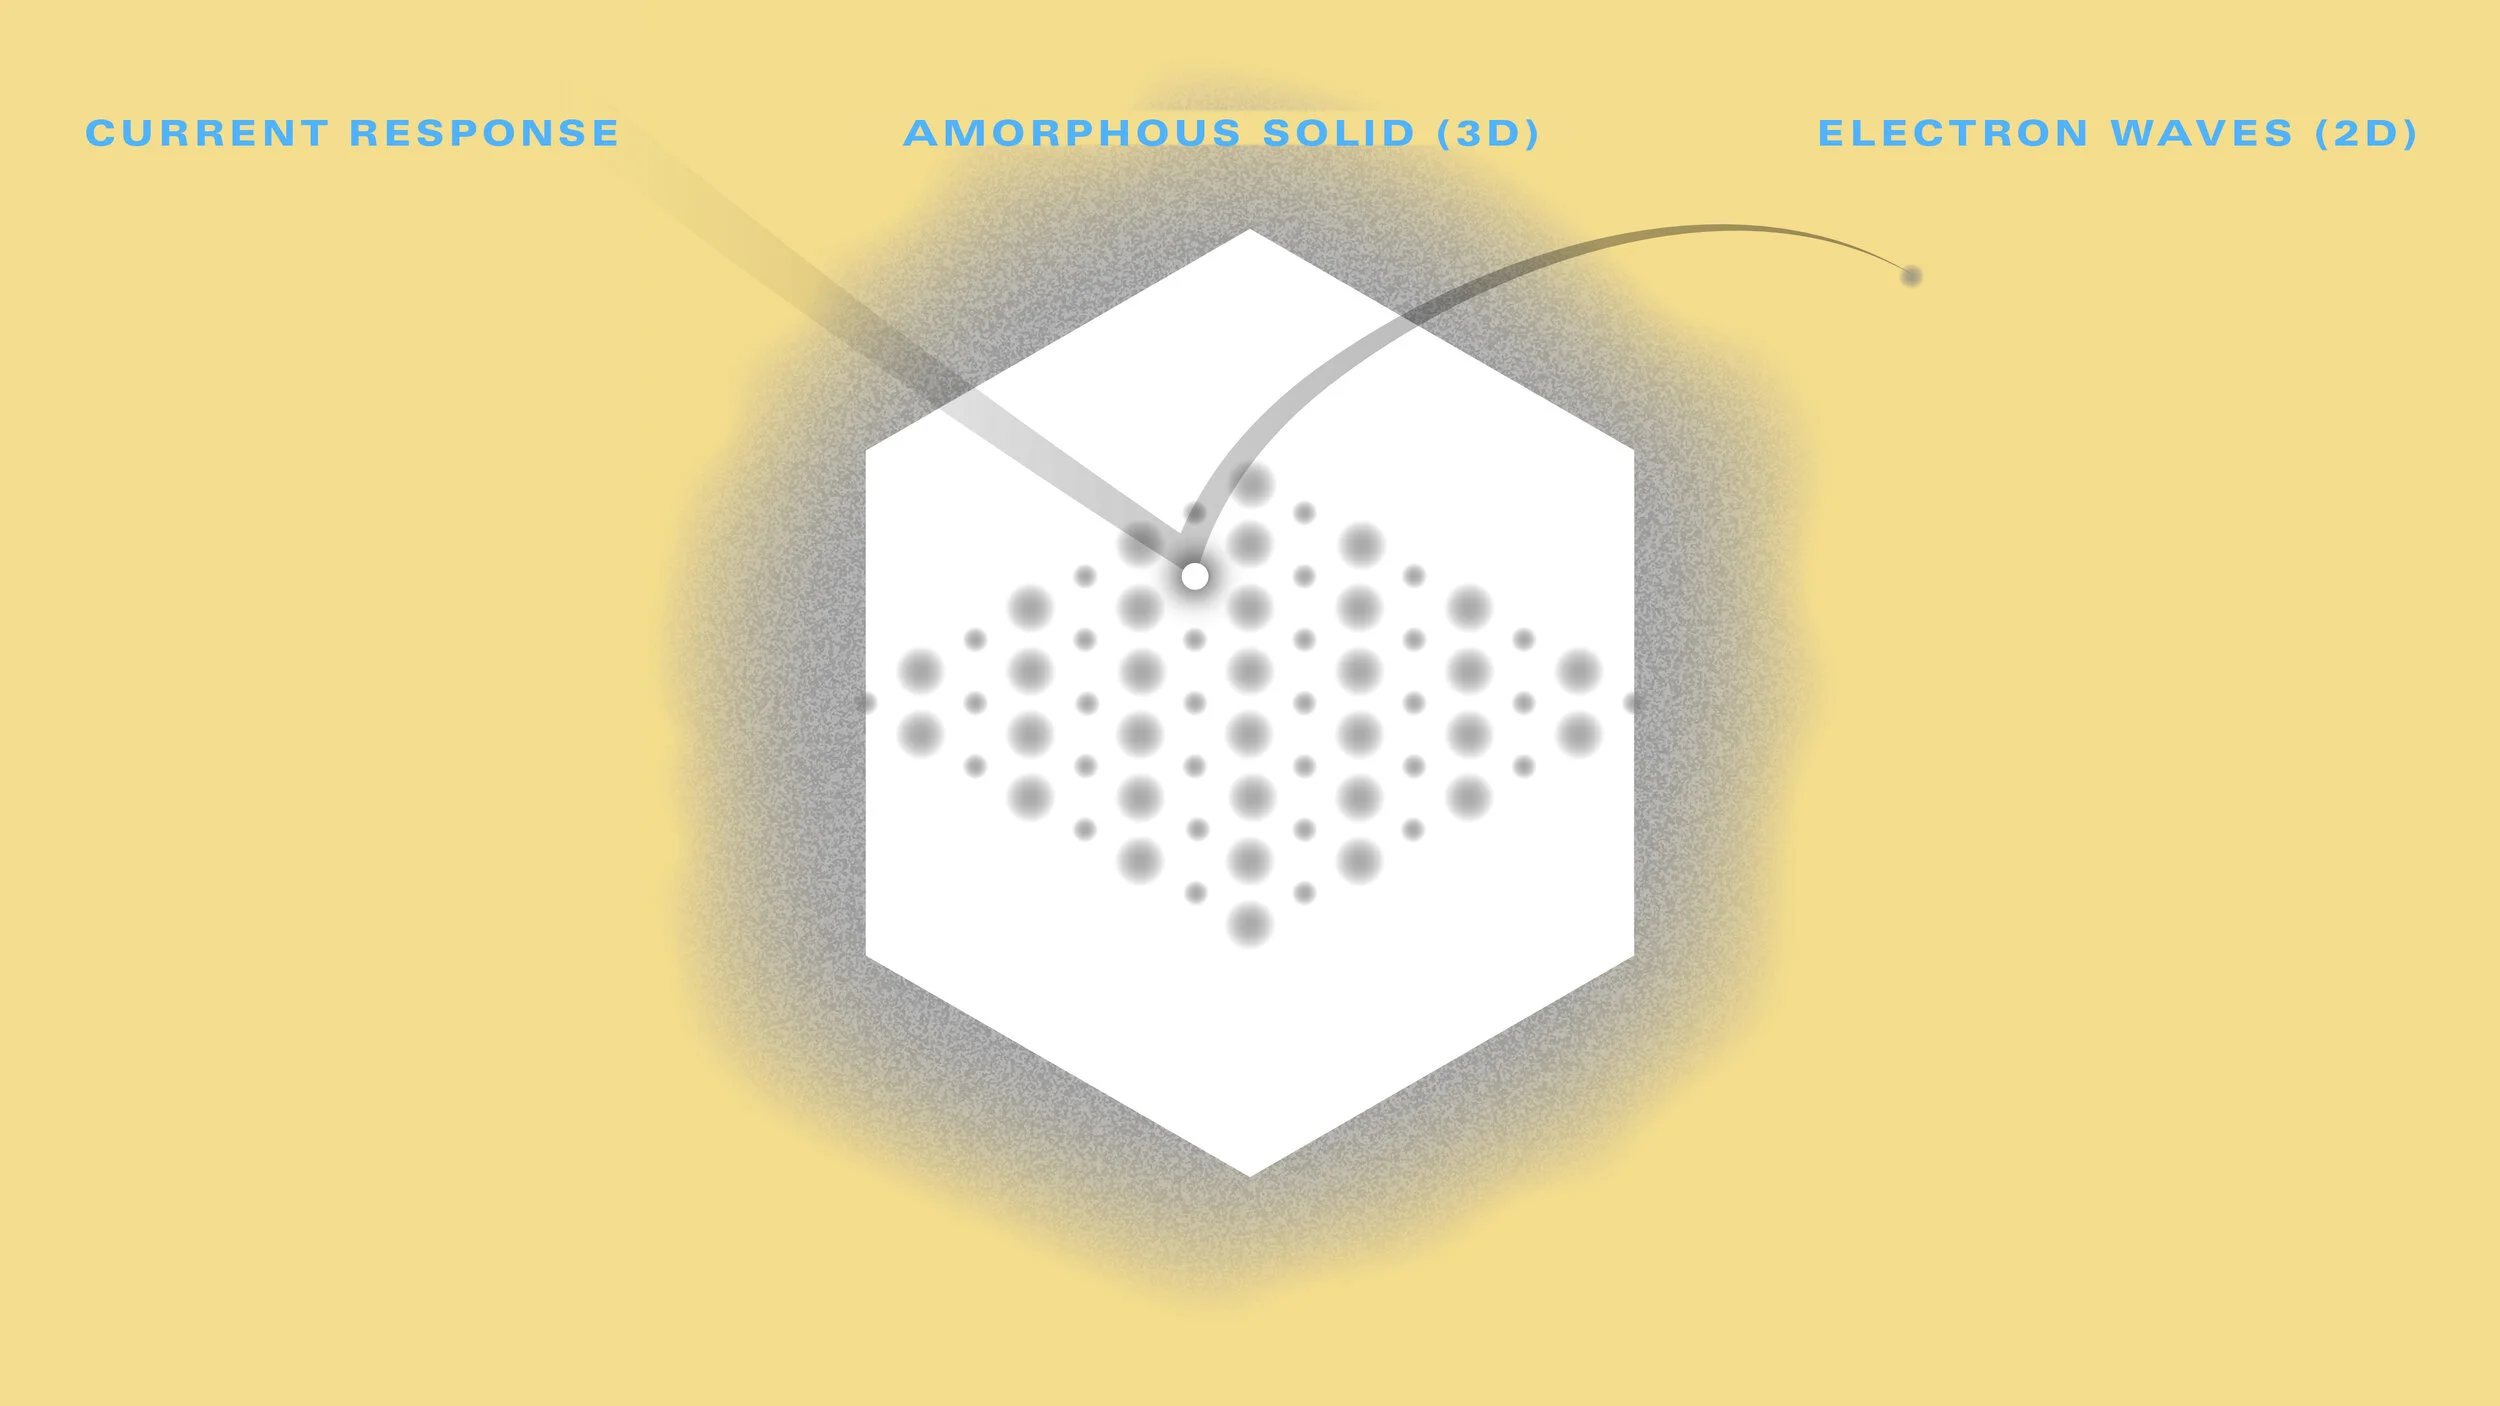
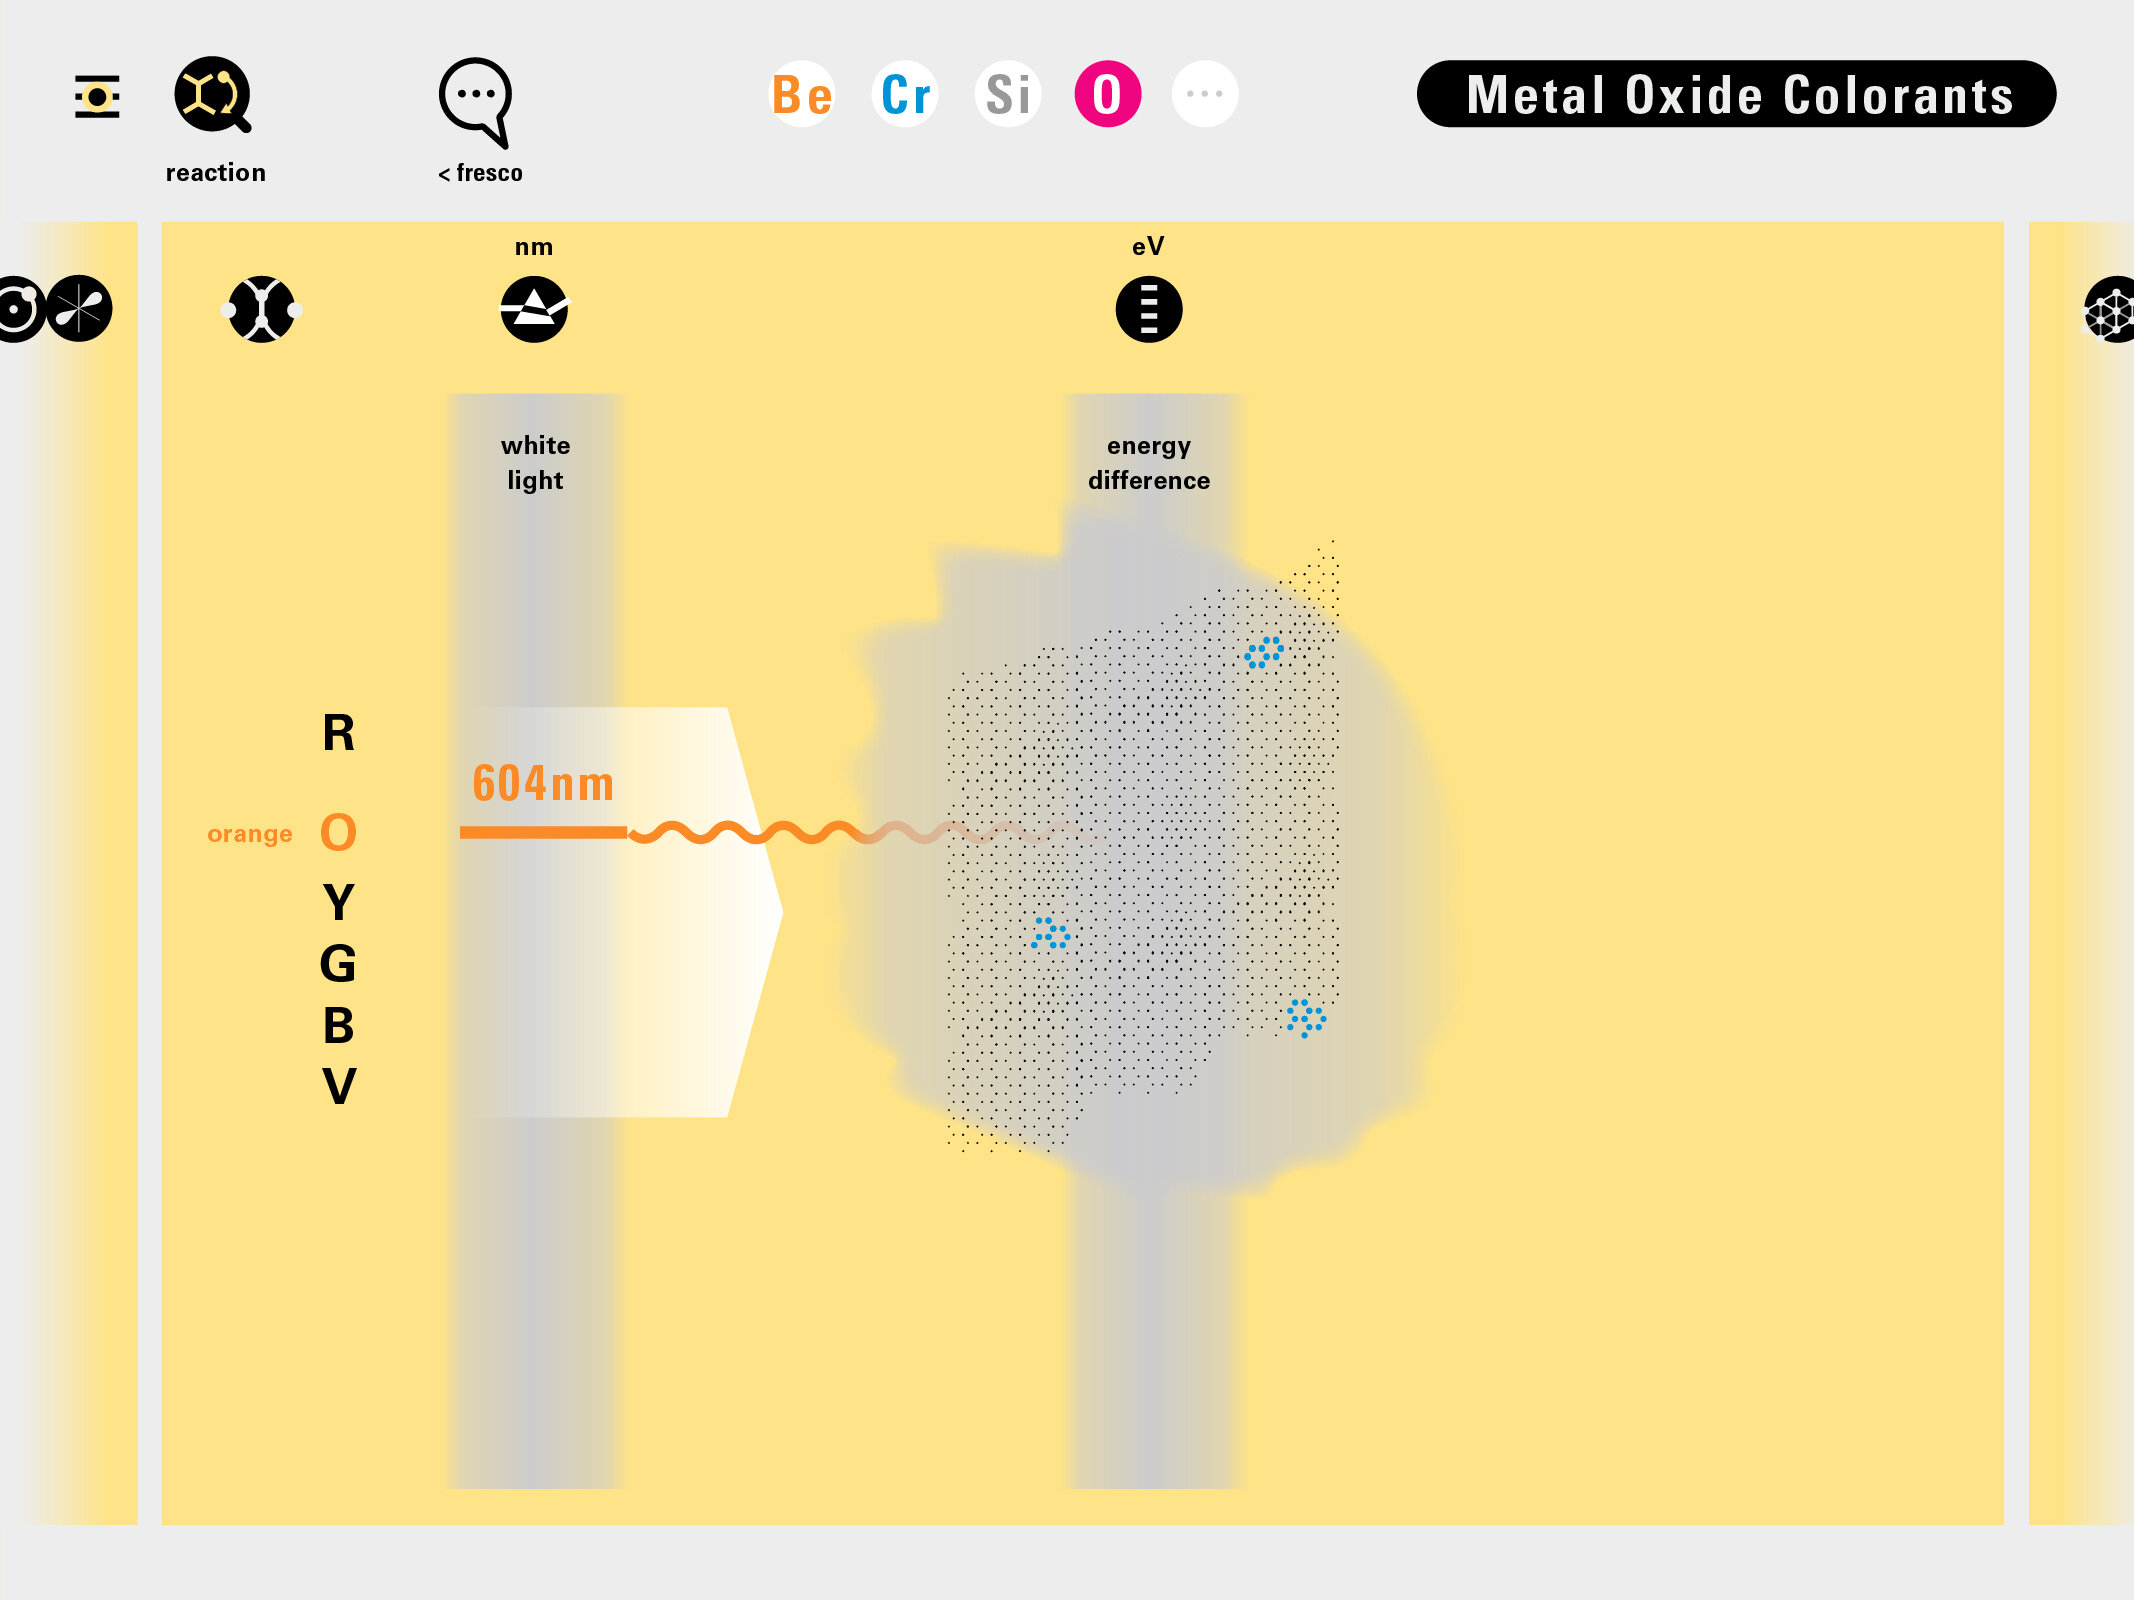
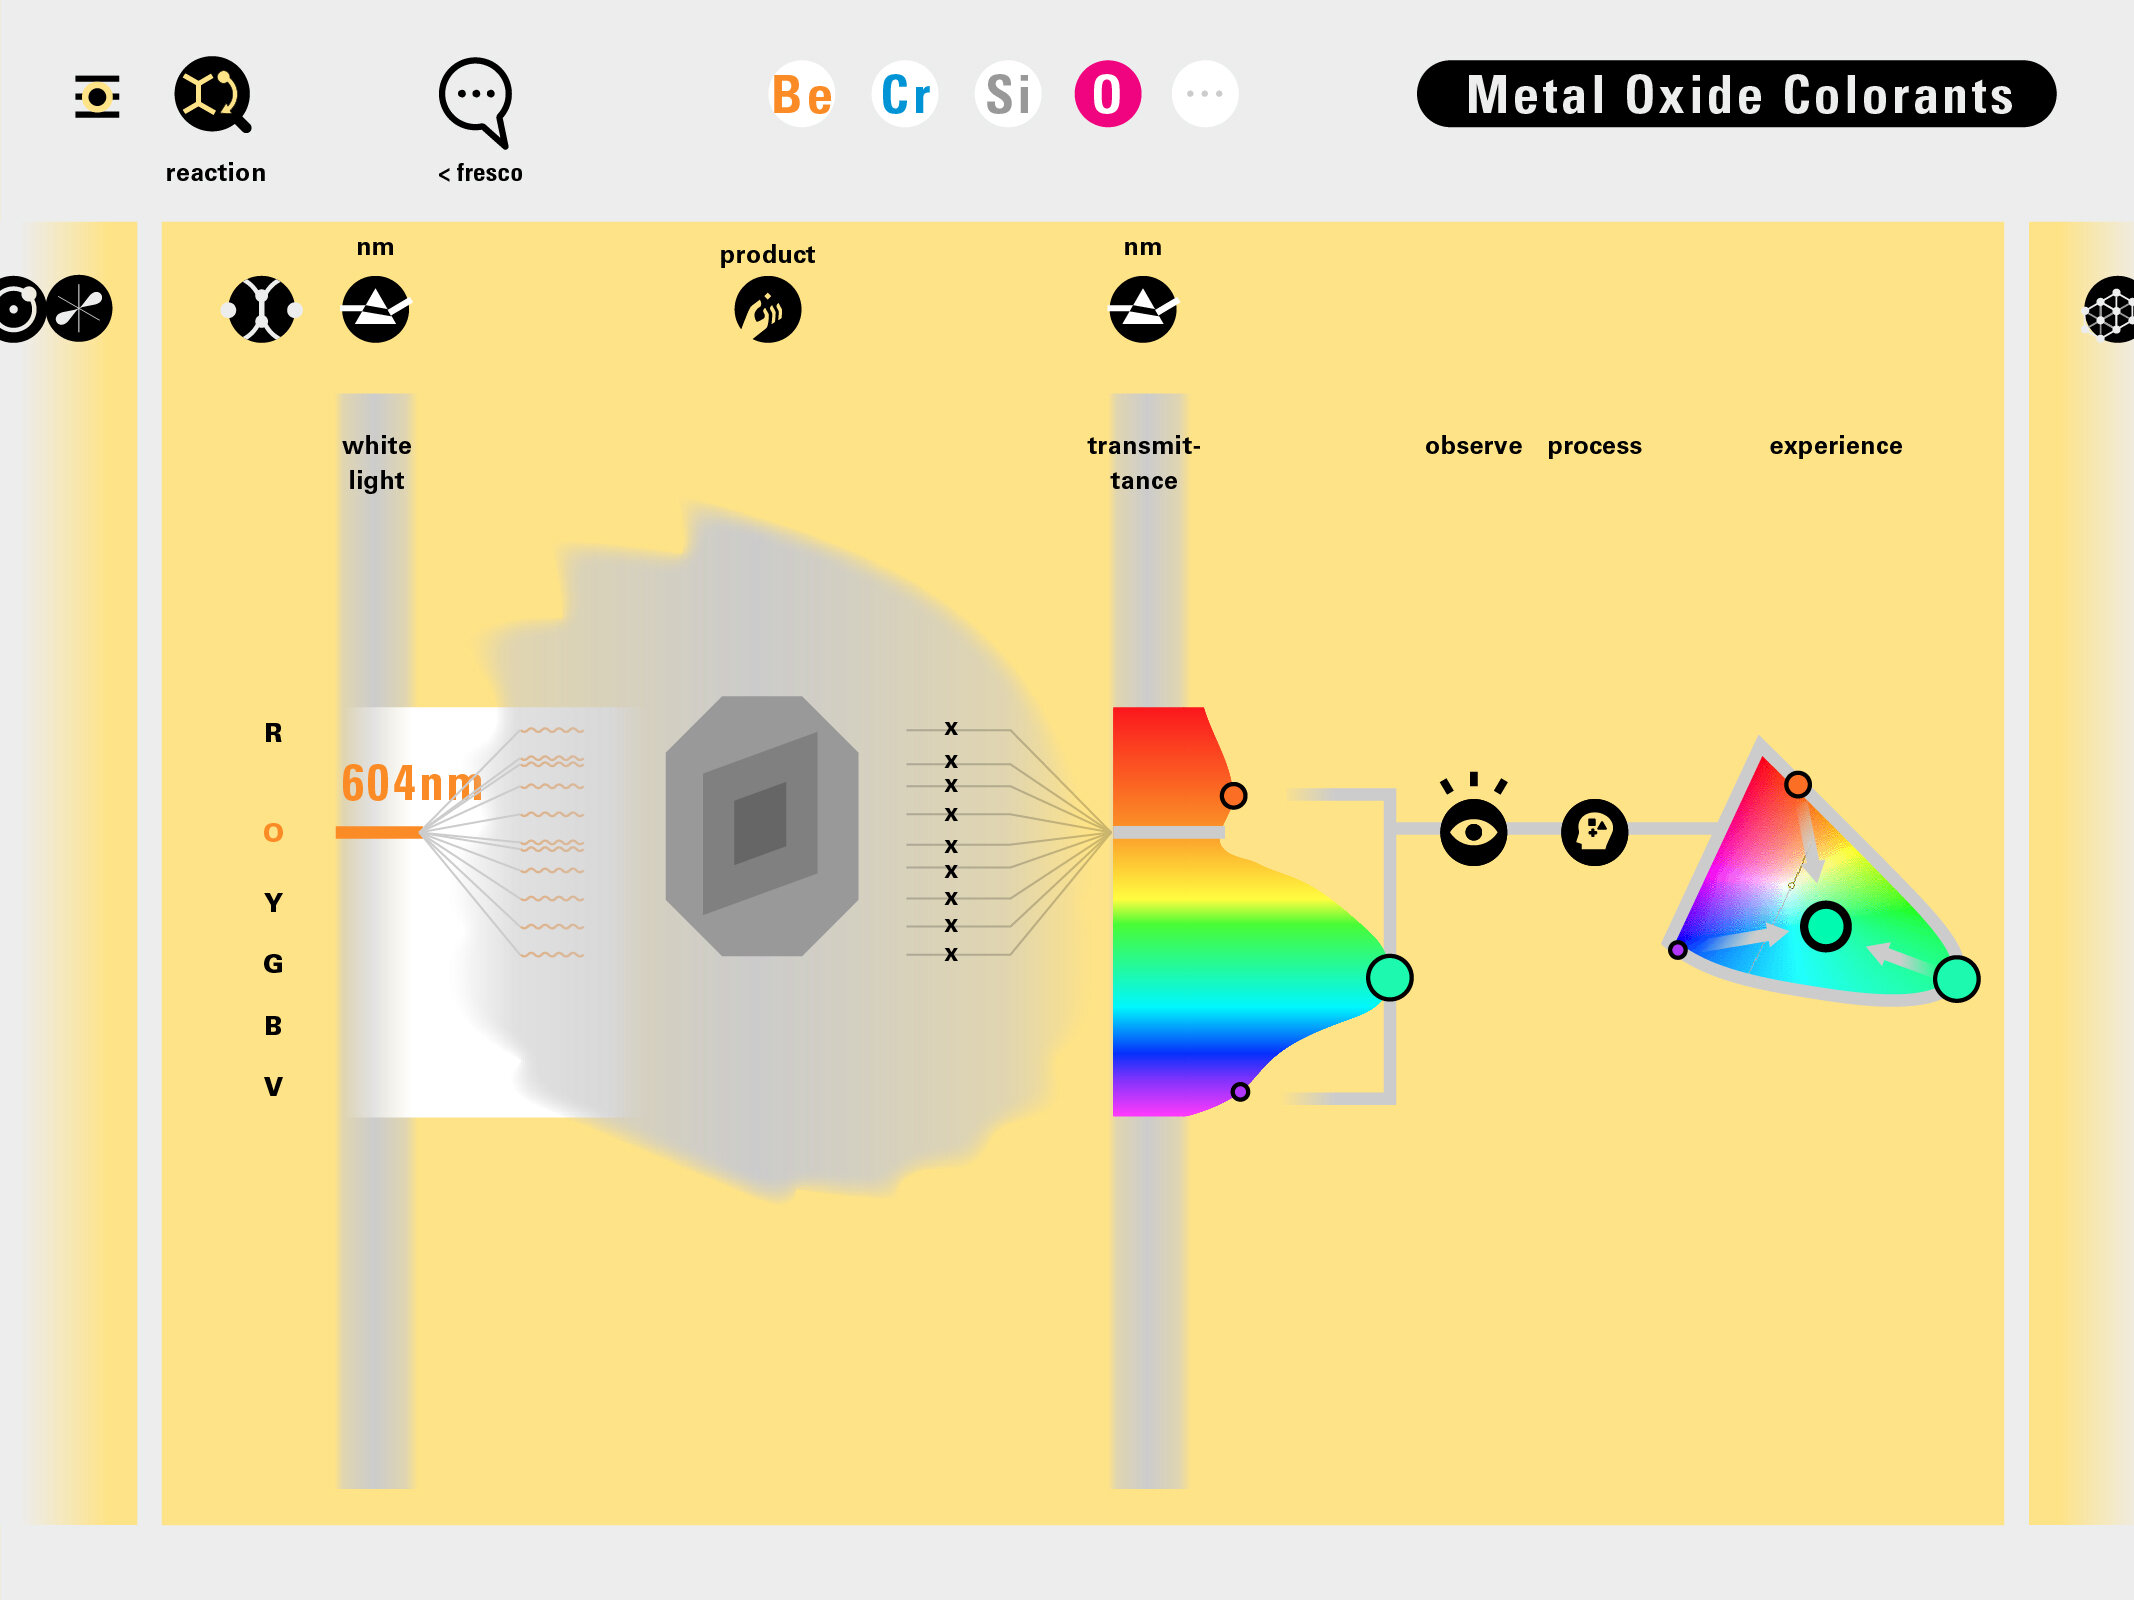
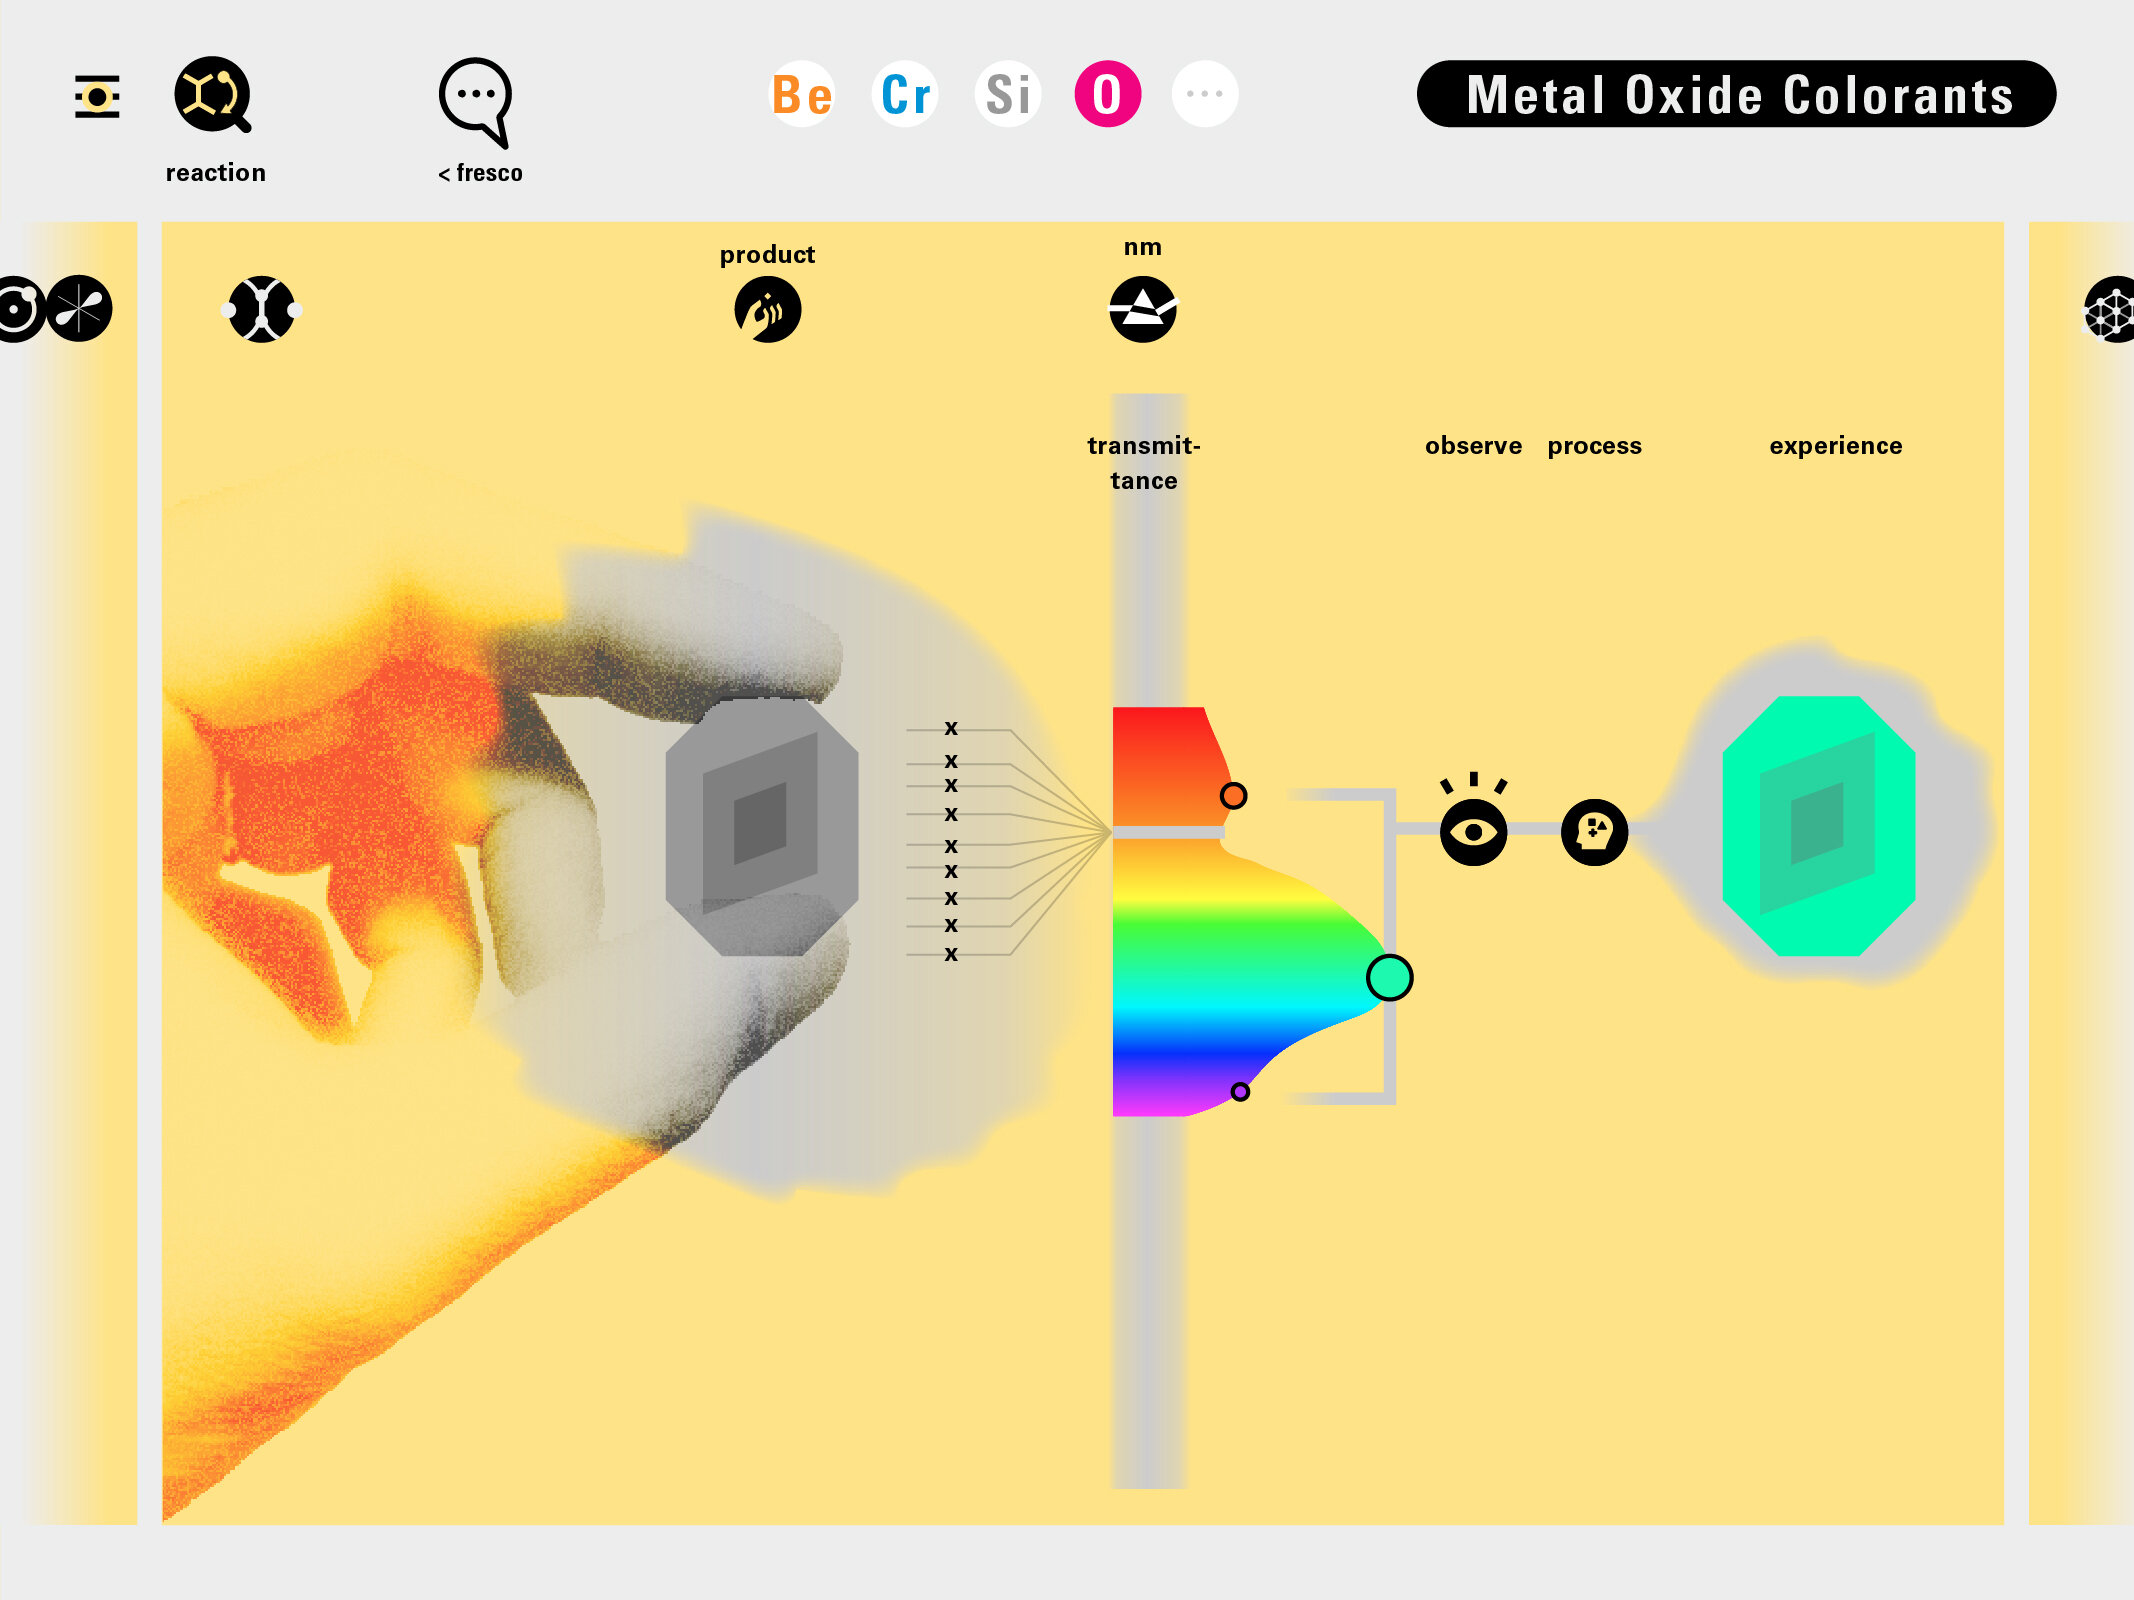
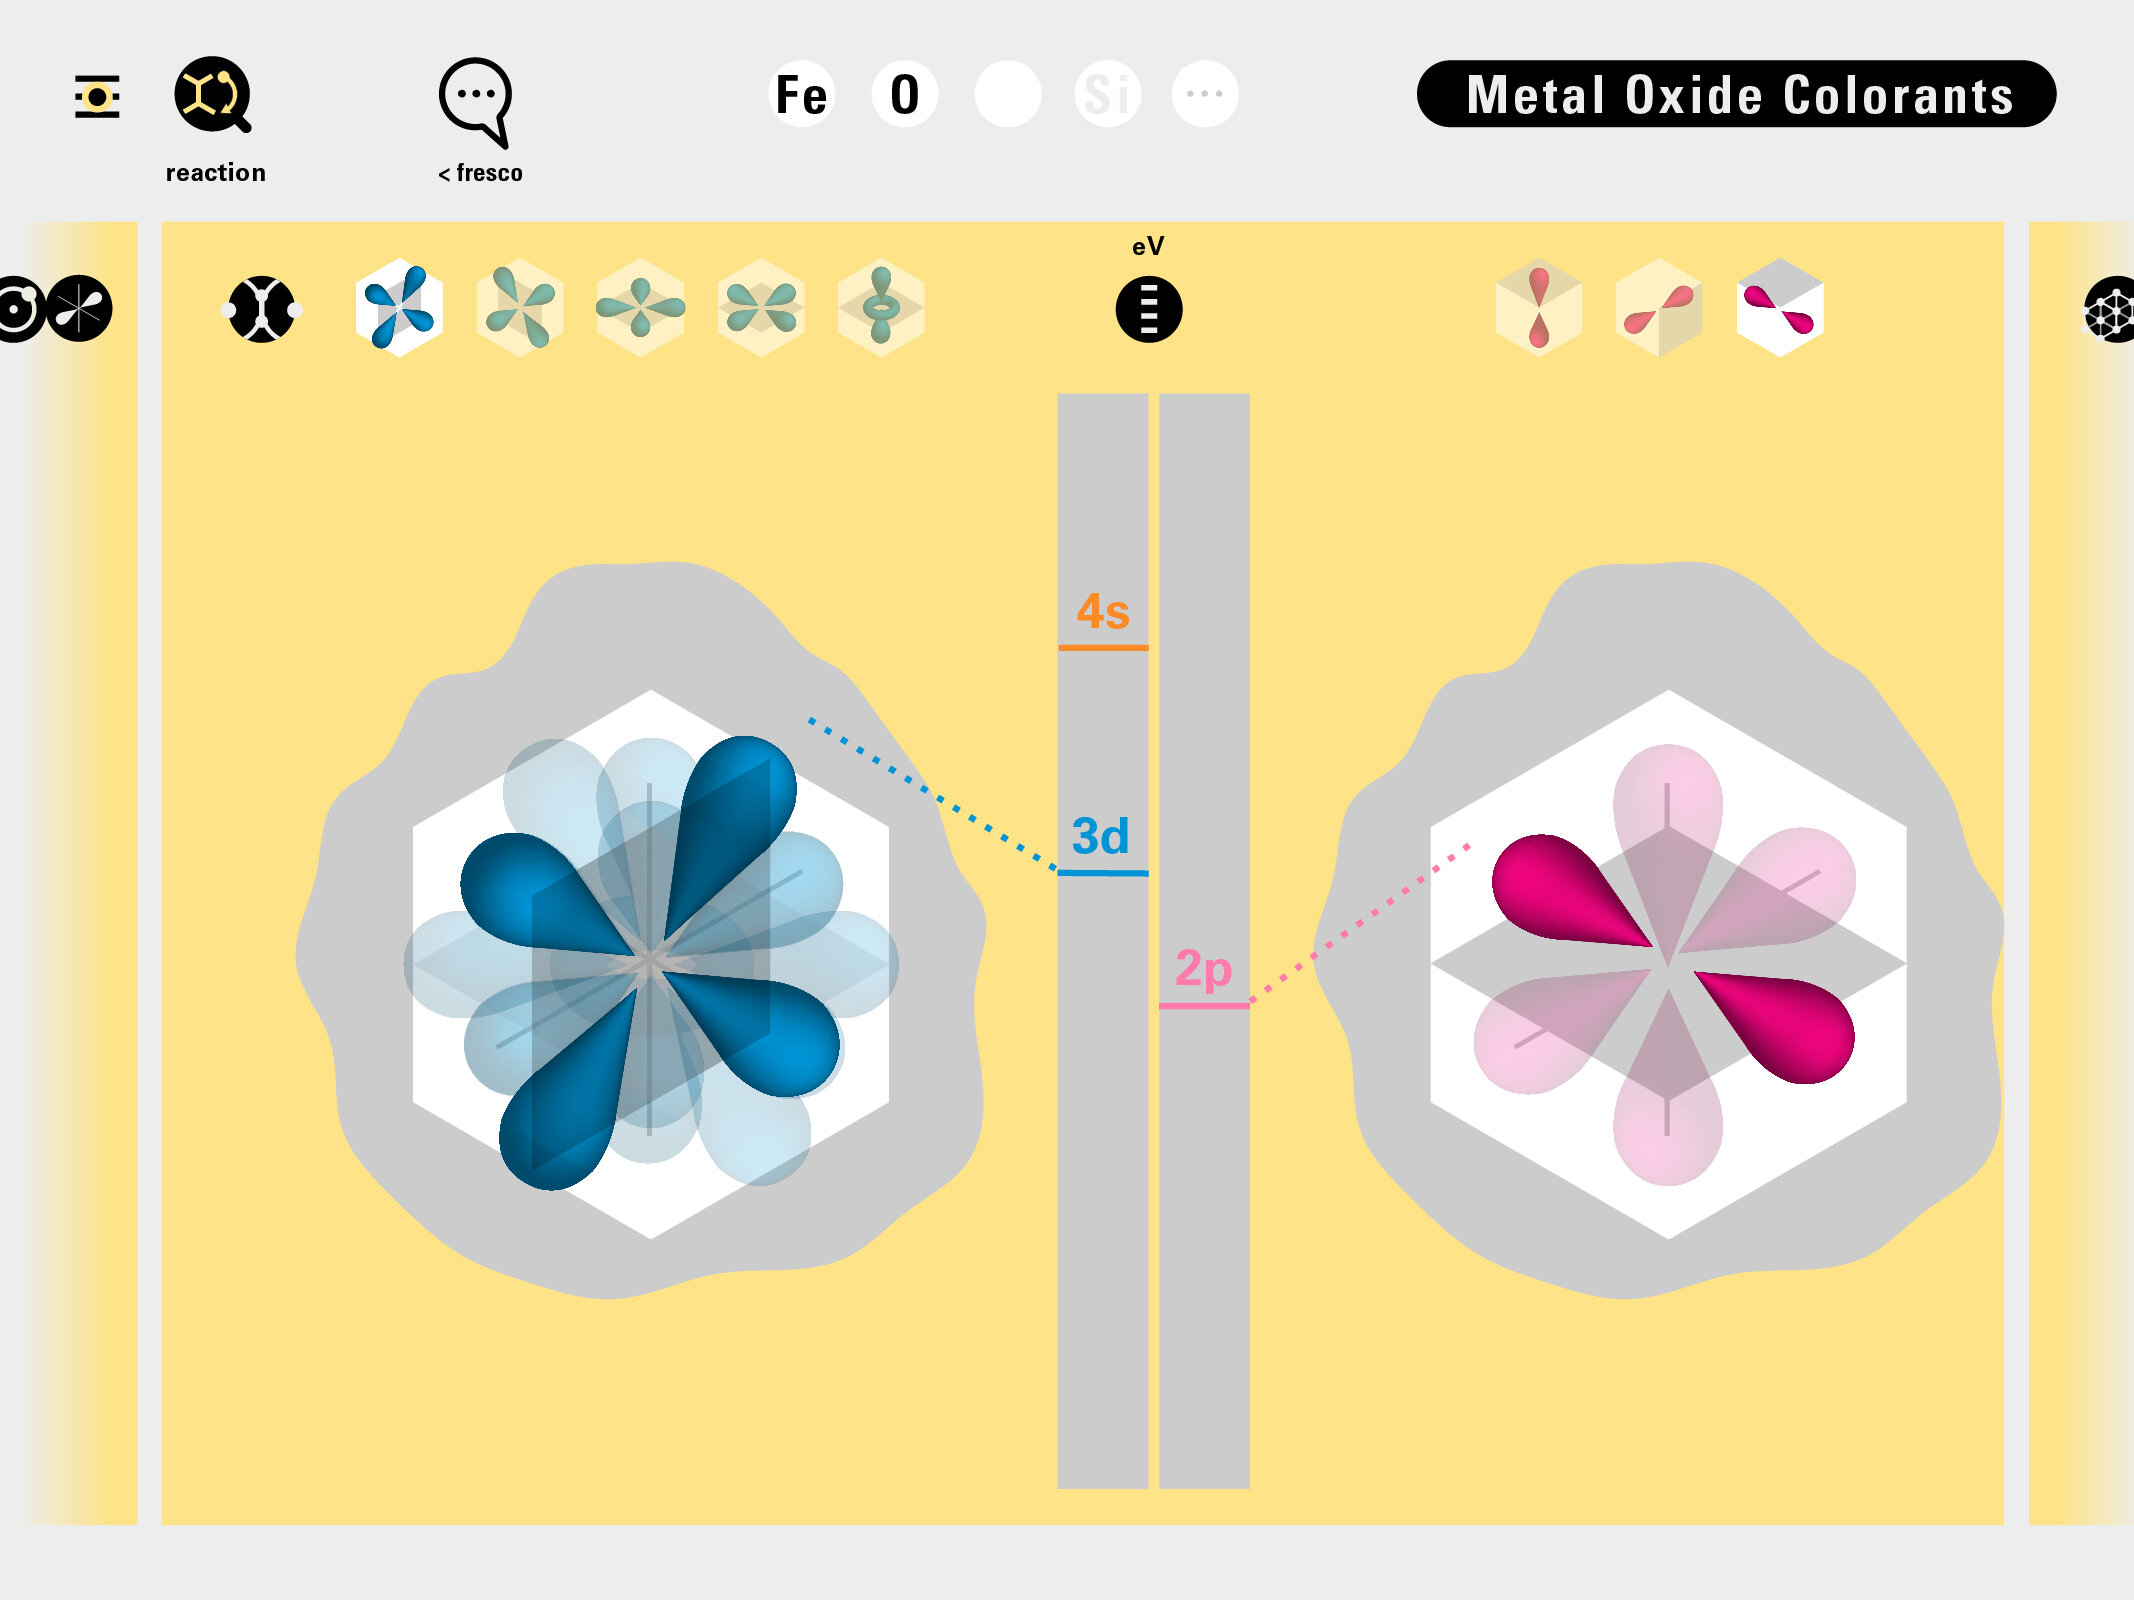
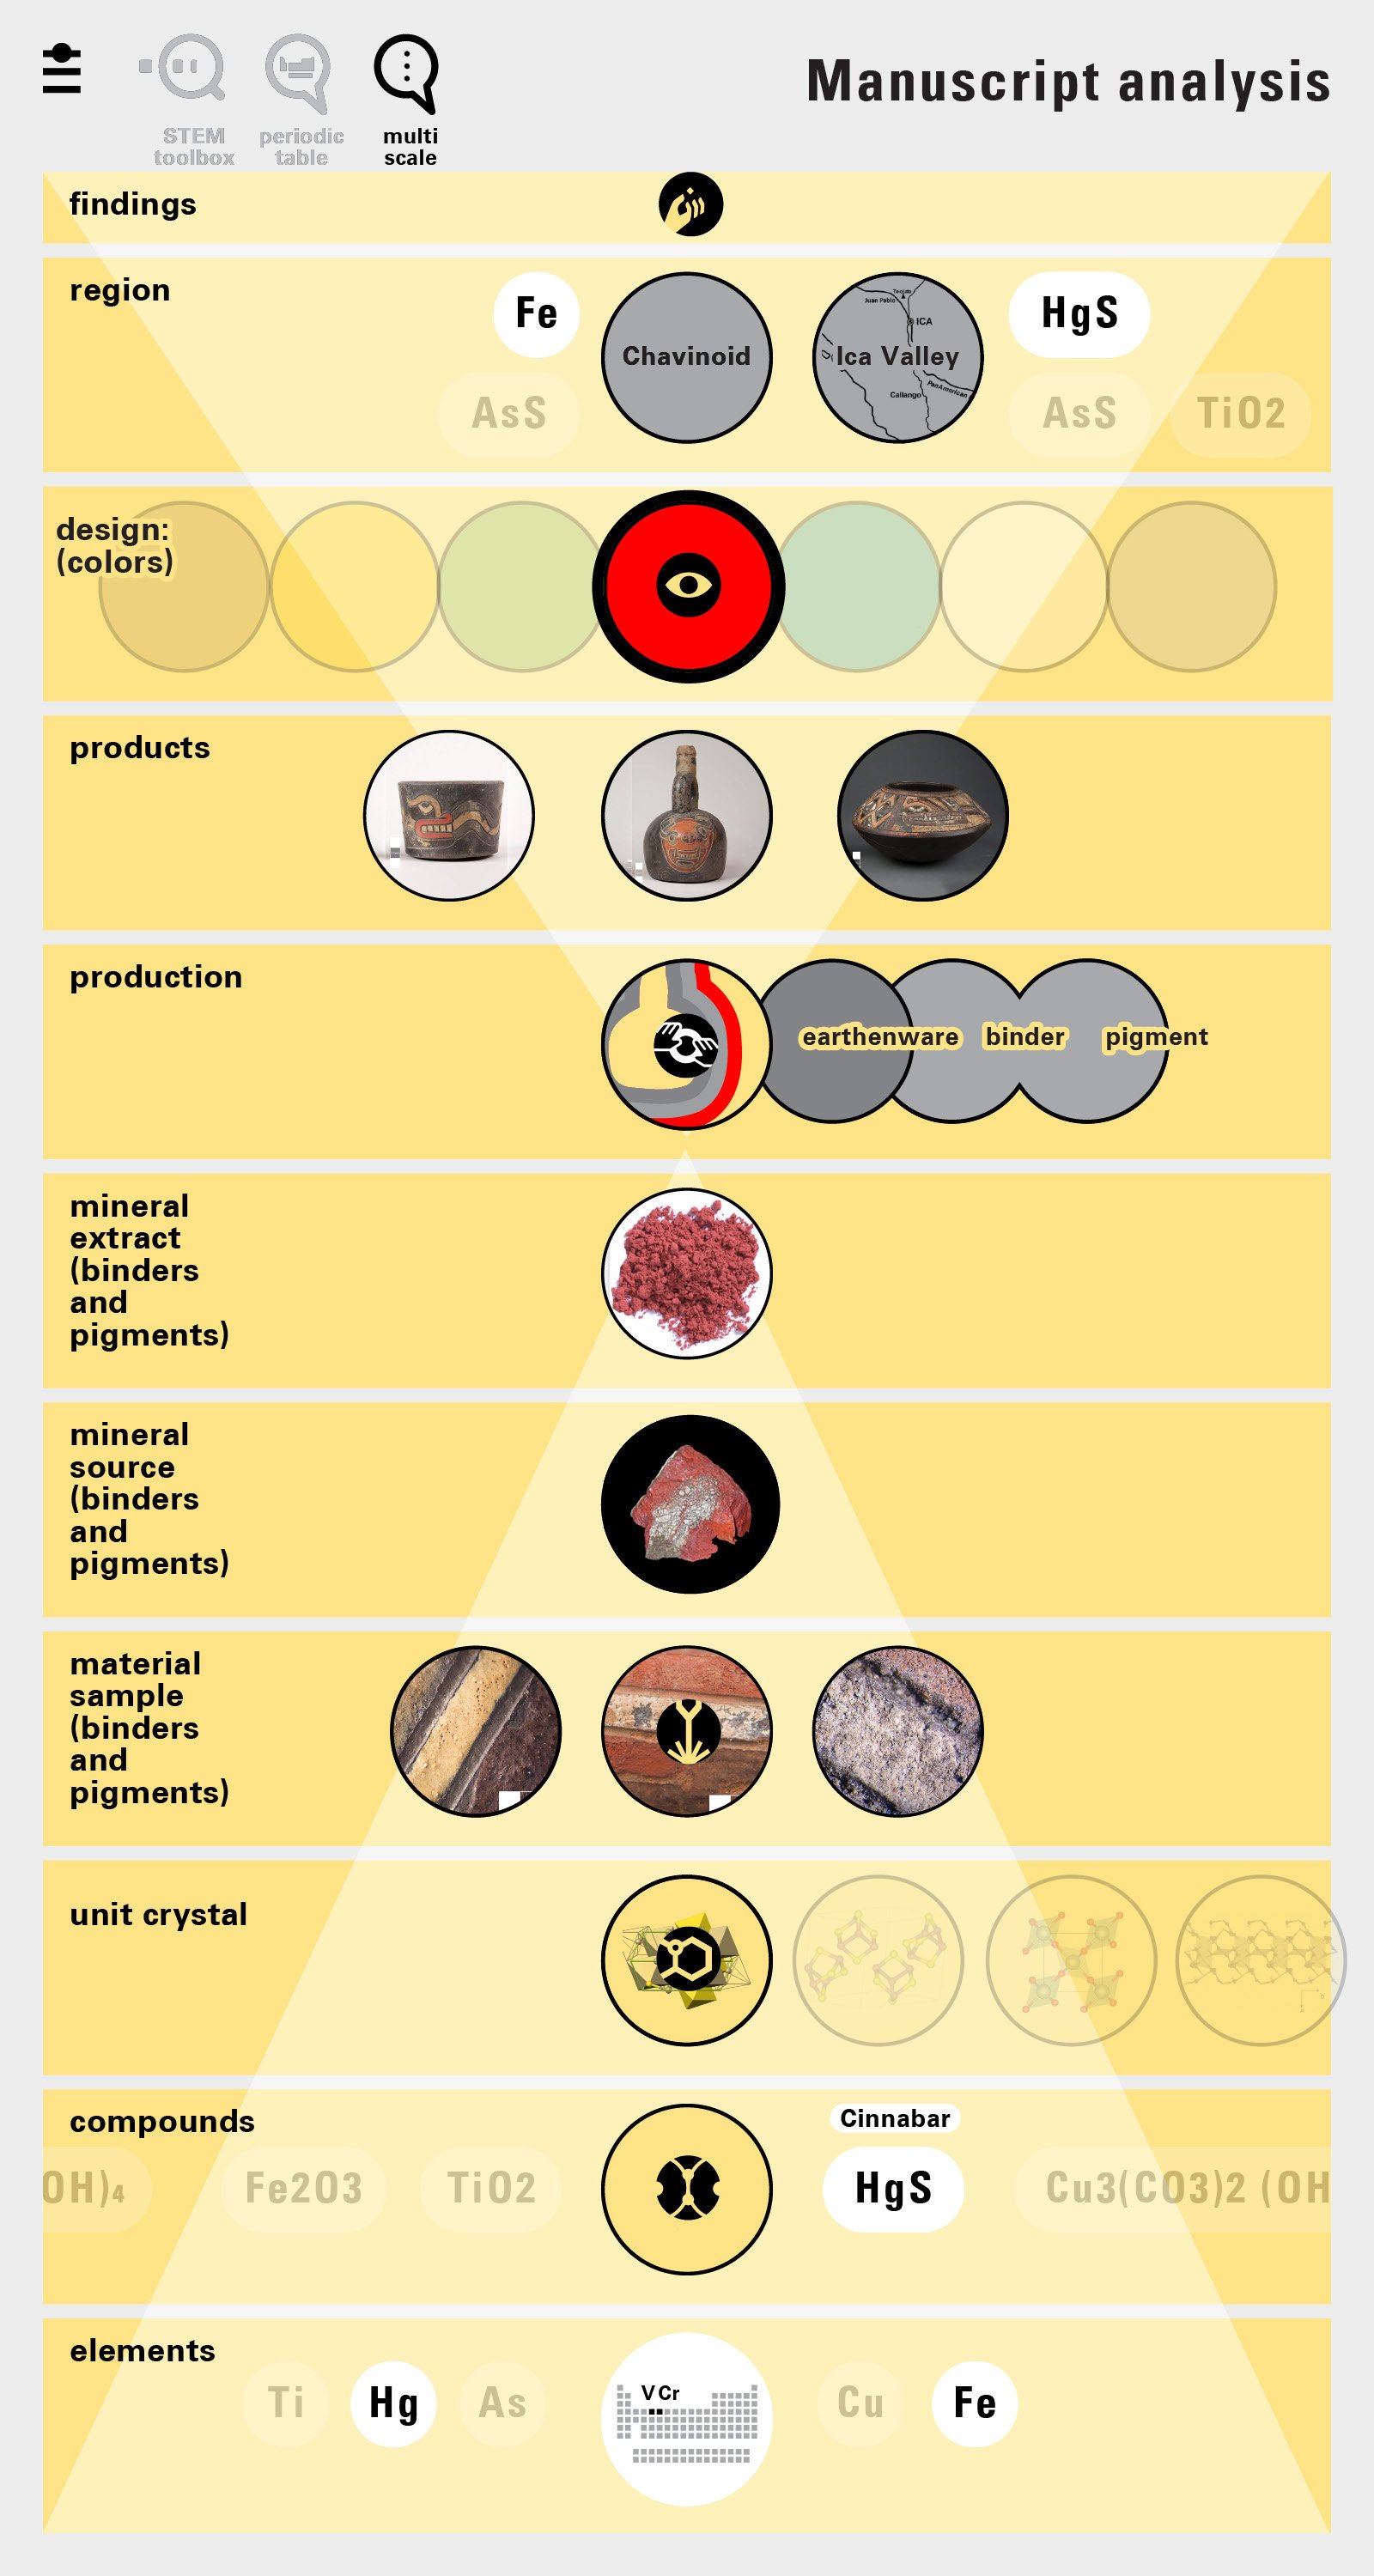
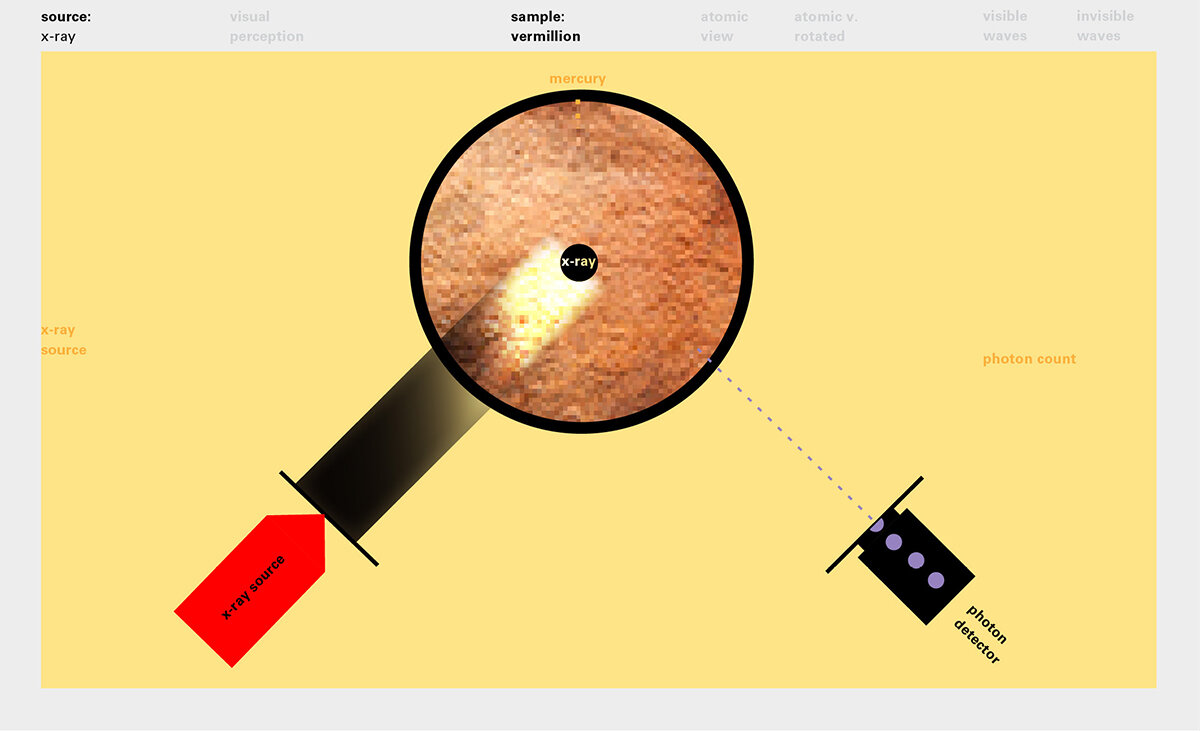
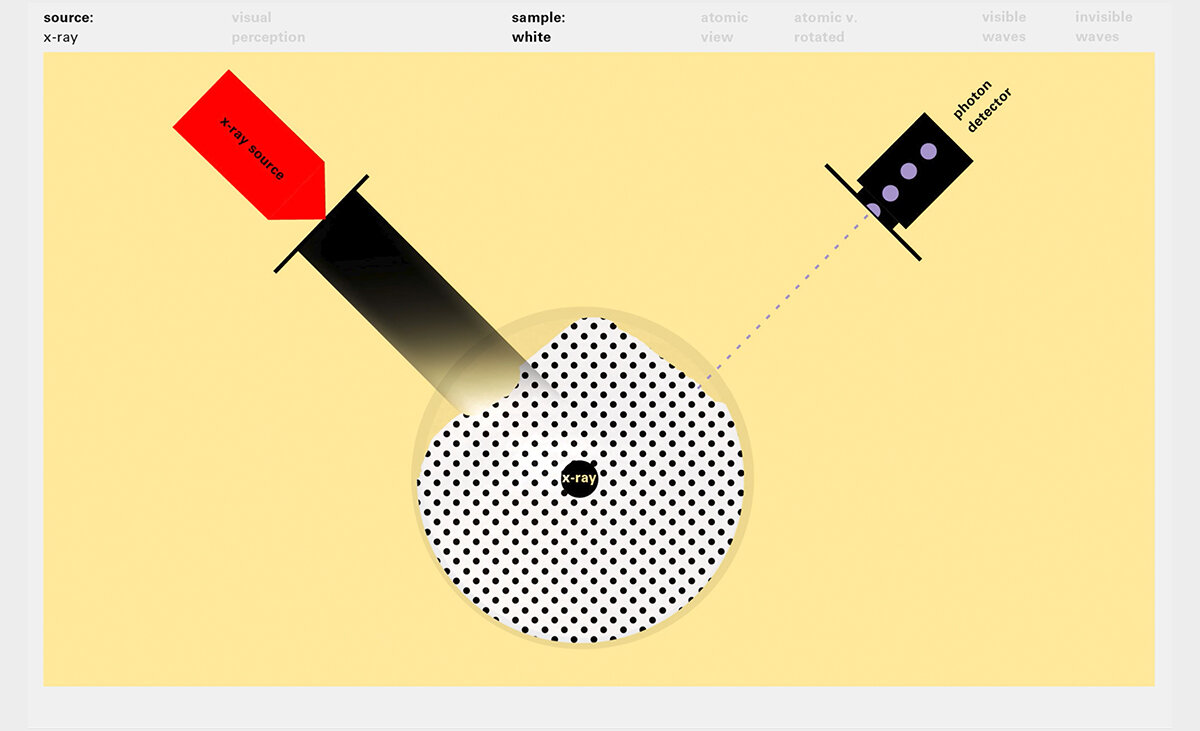
To this end, our first challenge was to reconcile three pictures of the atom: atom as an energy phenomenon, a spatial entity, and a conceptual entry on the periodic table. Our goal was to produce a ‘legible’ periodic table with which users could predict how an element would form and how two elements would bond into molecules. Learners would grasp the logic of the periodic table and its relationship with the Bohr model of the atom without need for memorization.

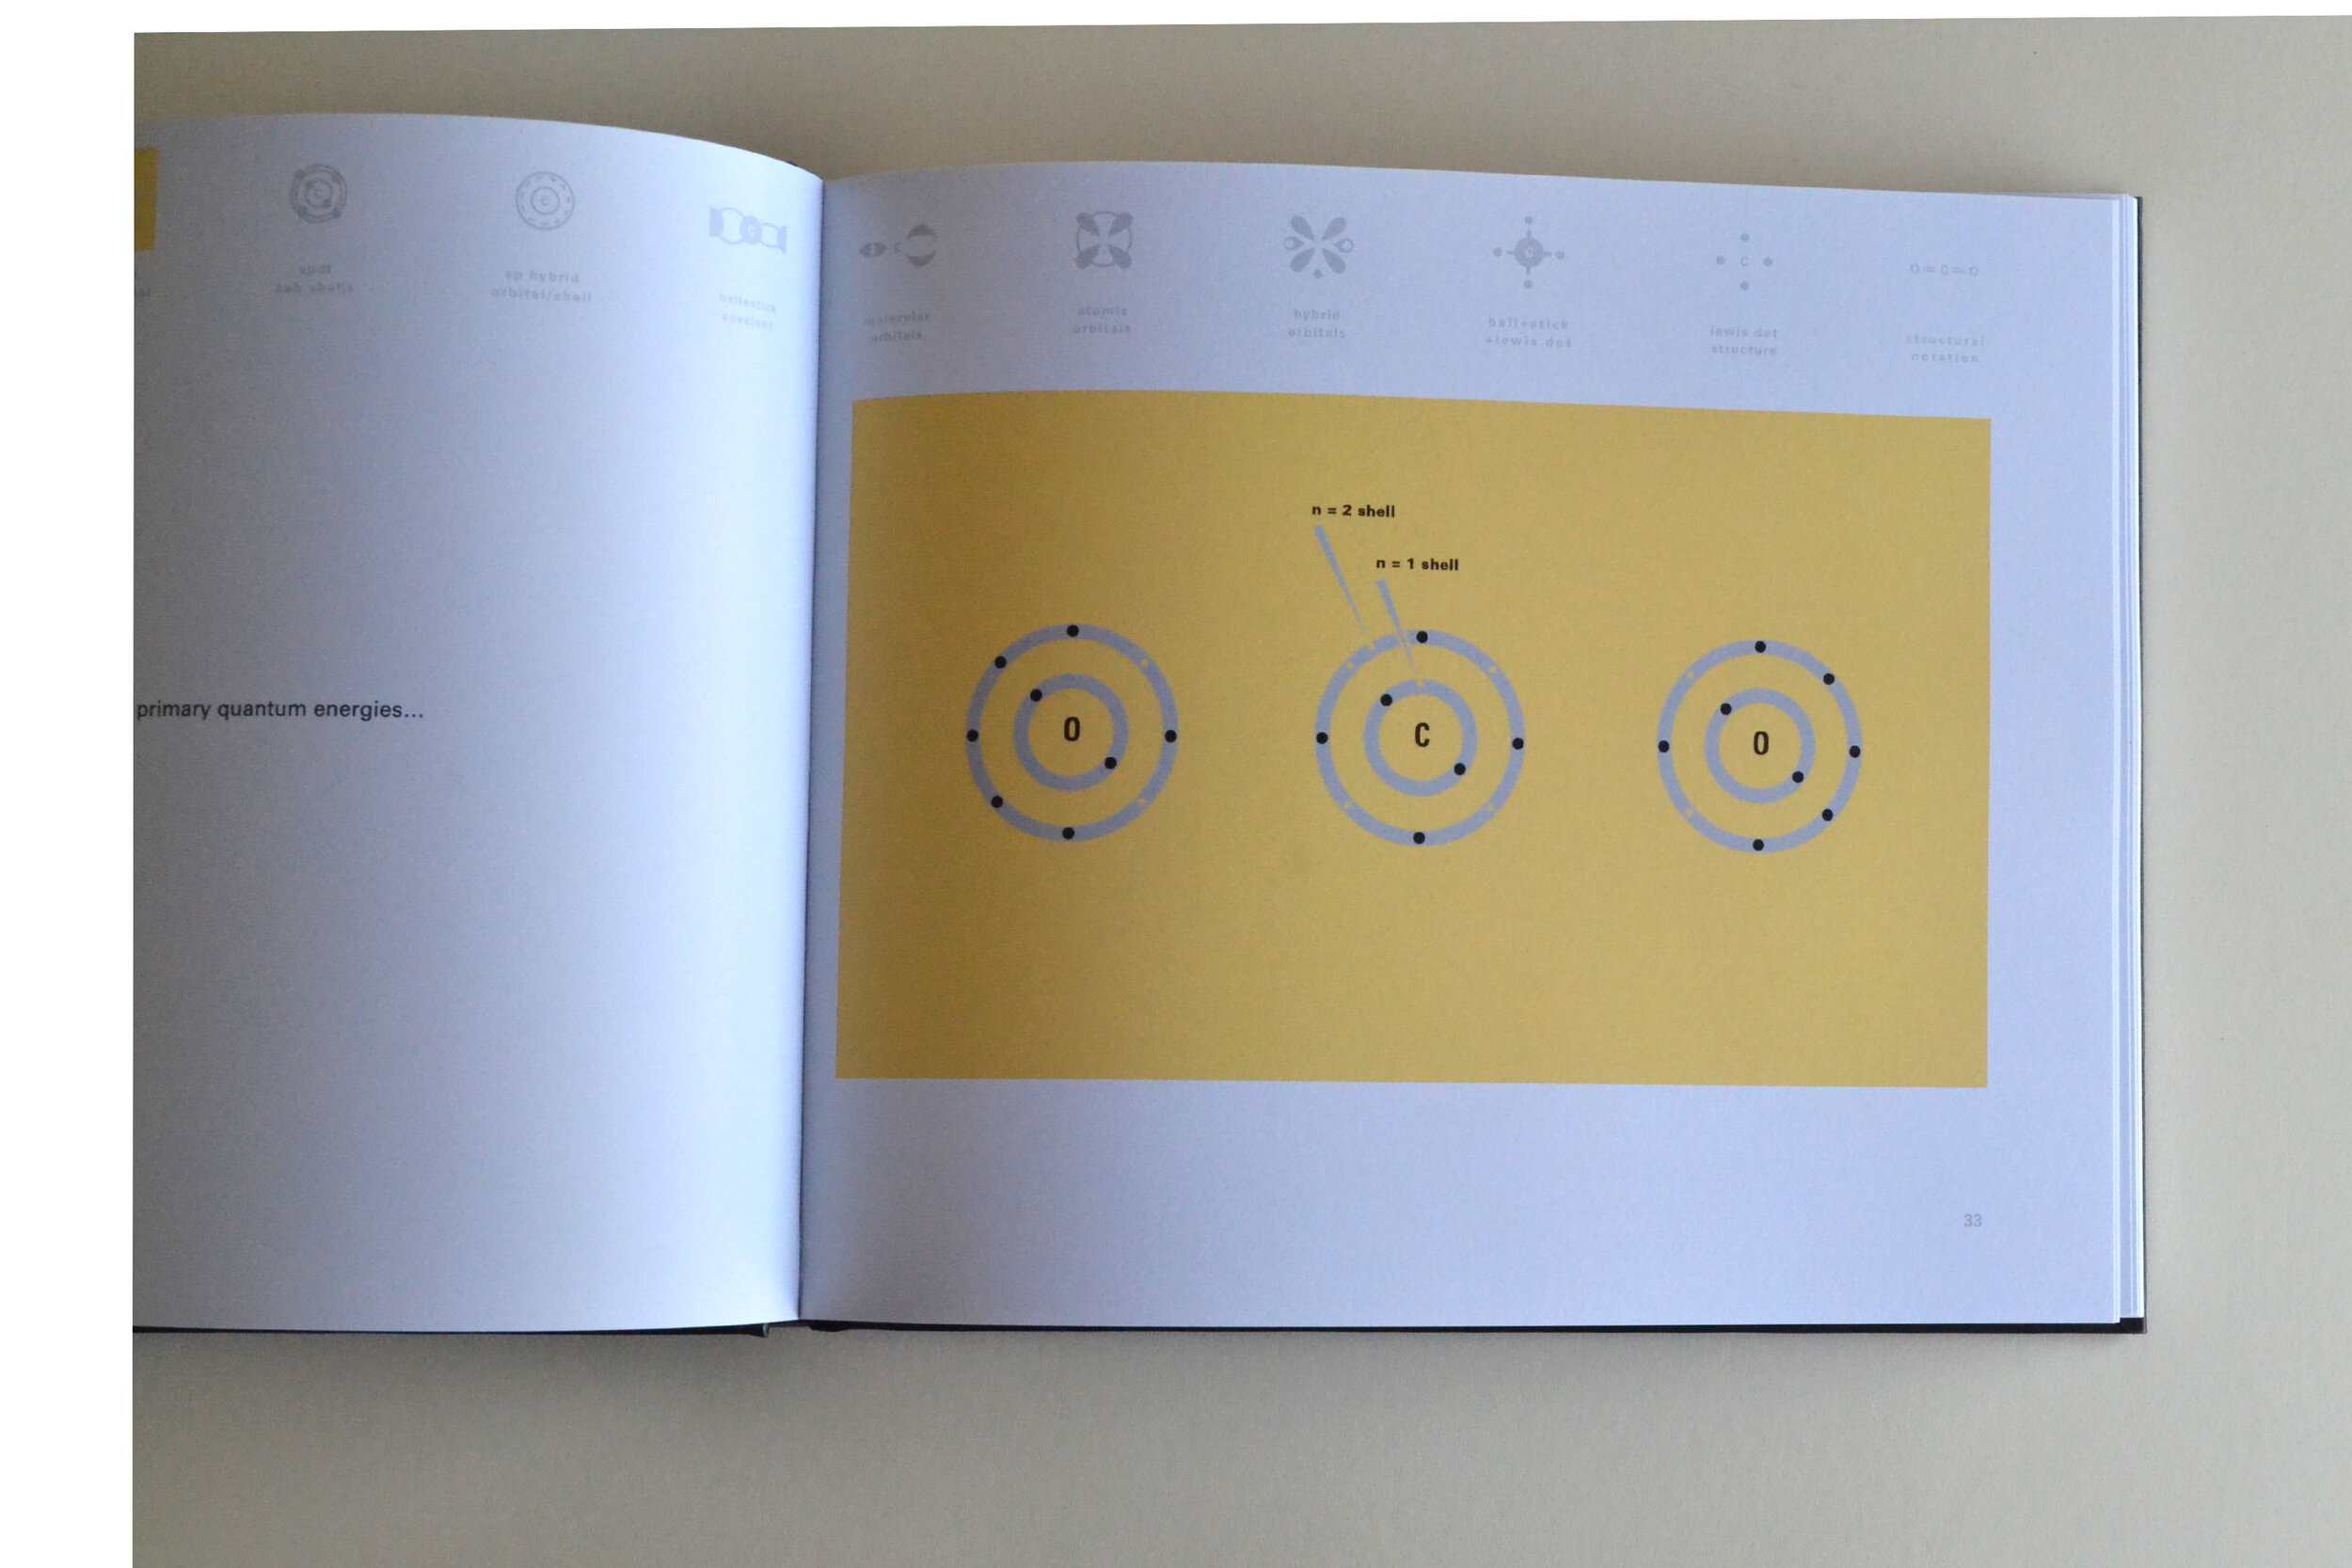
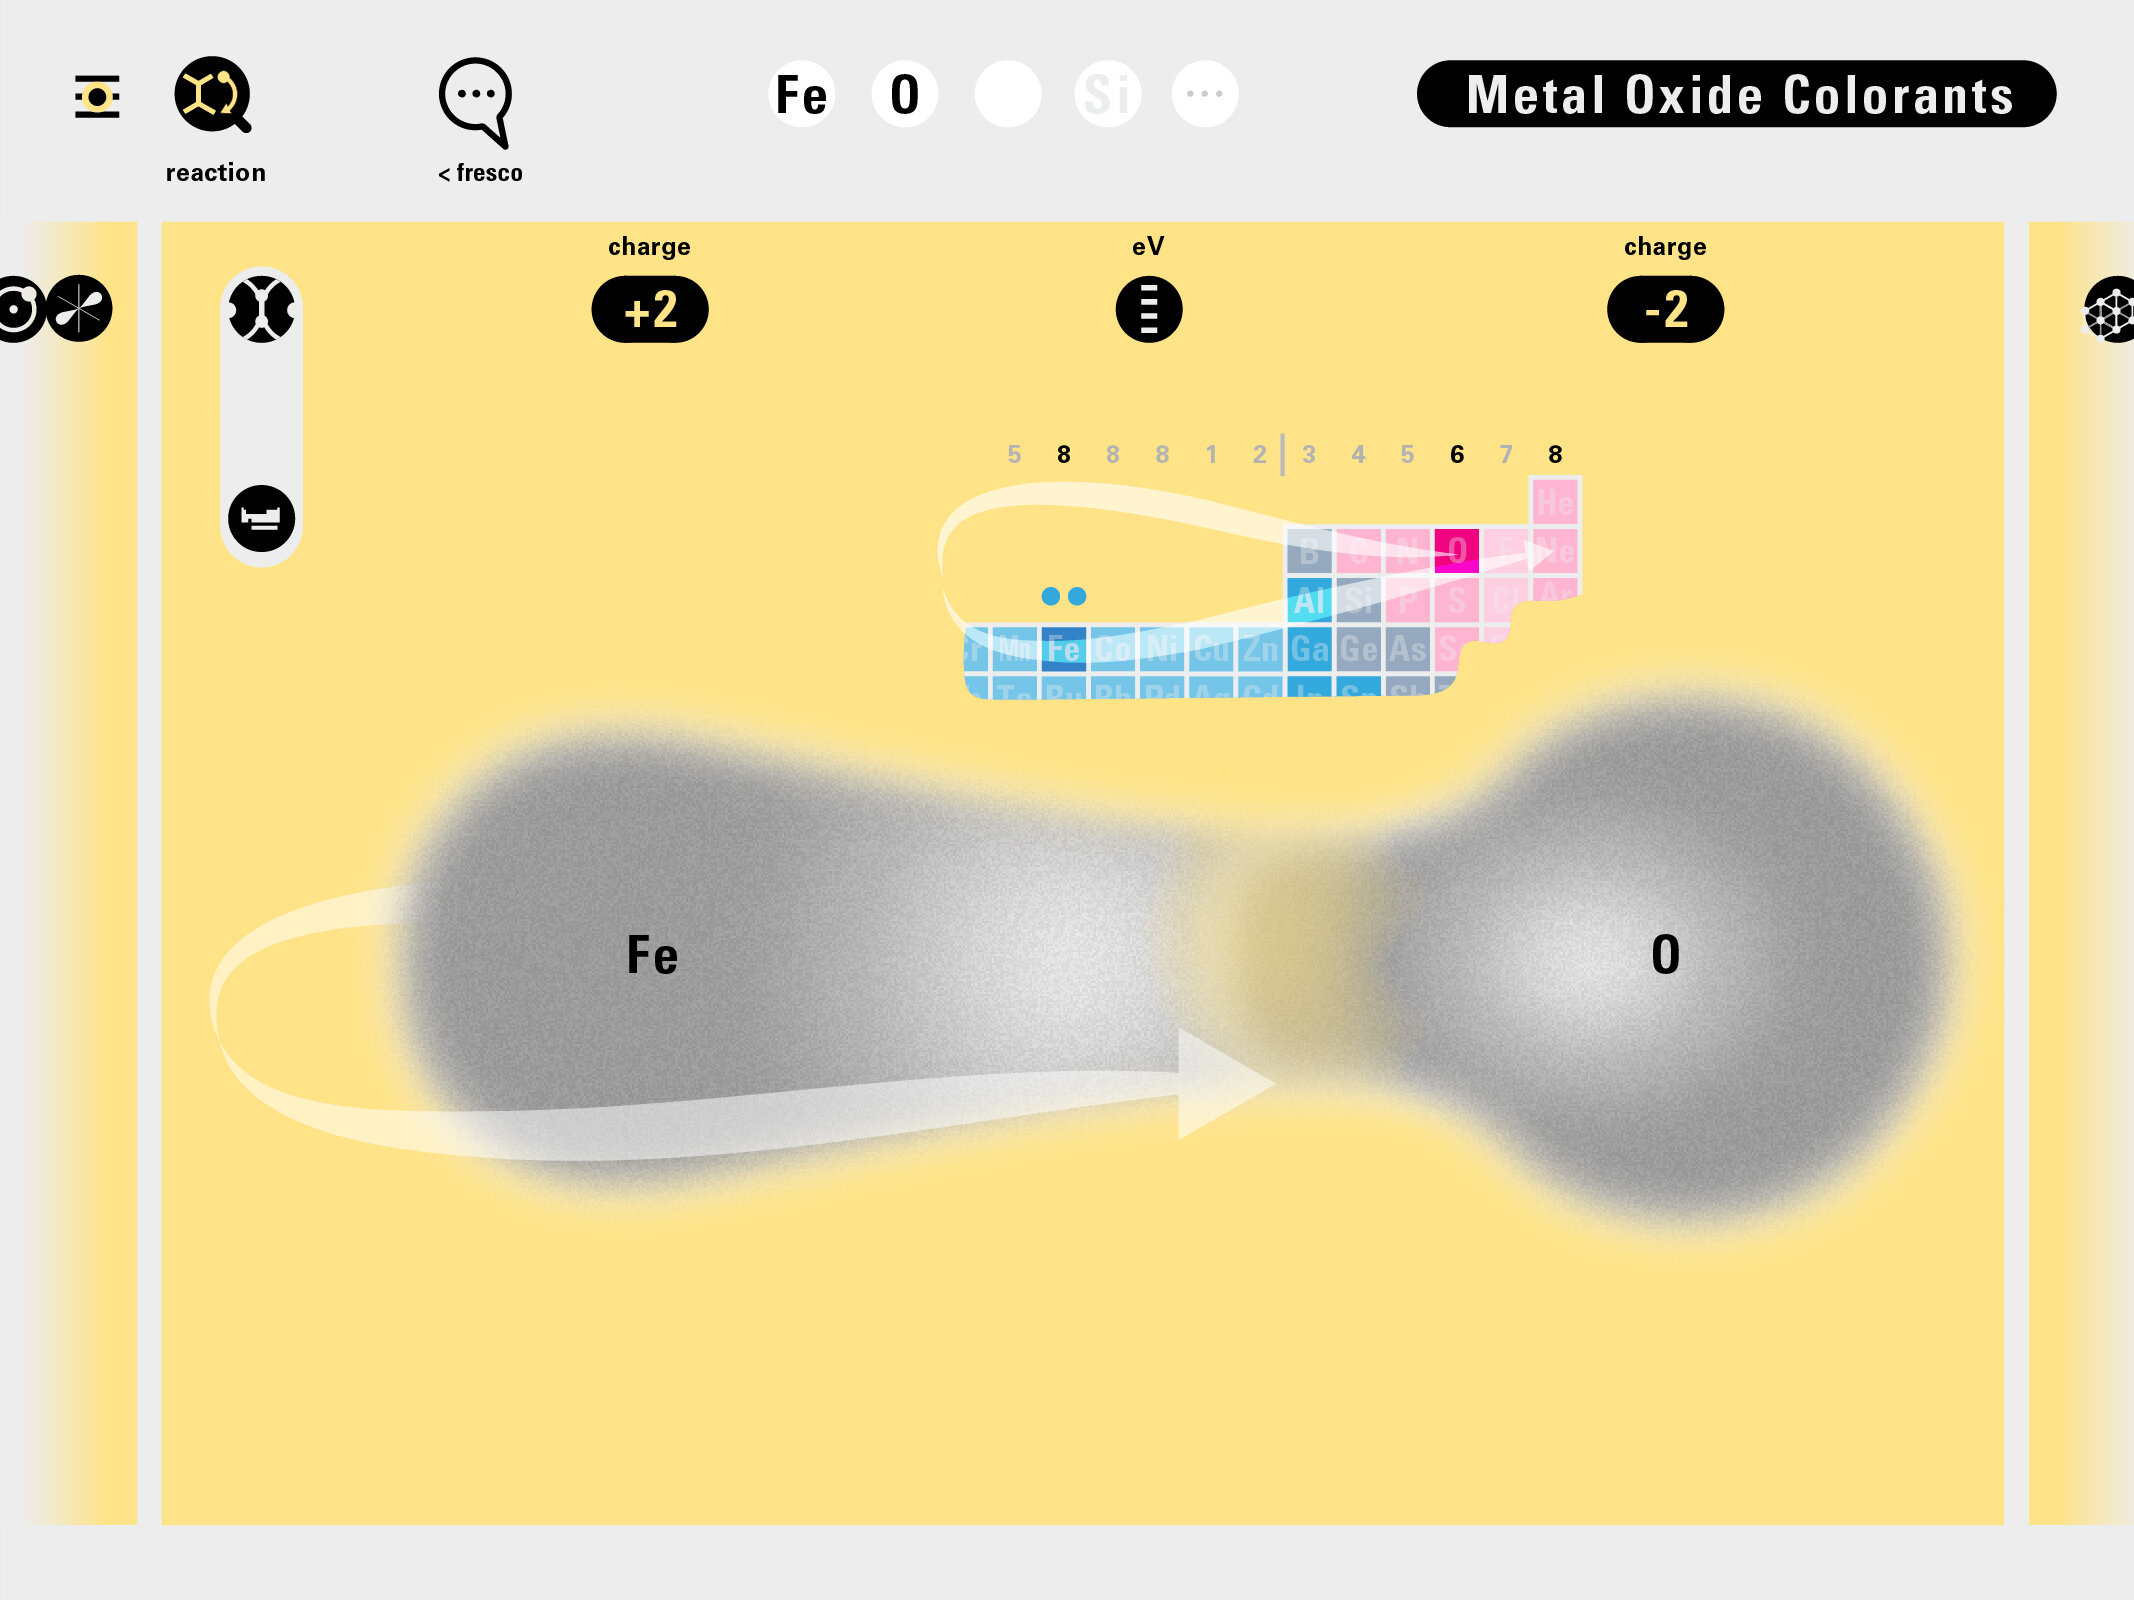
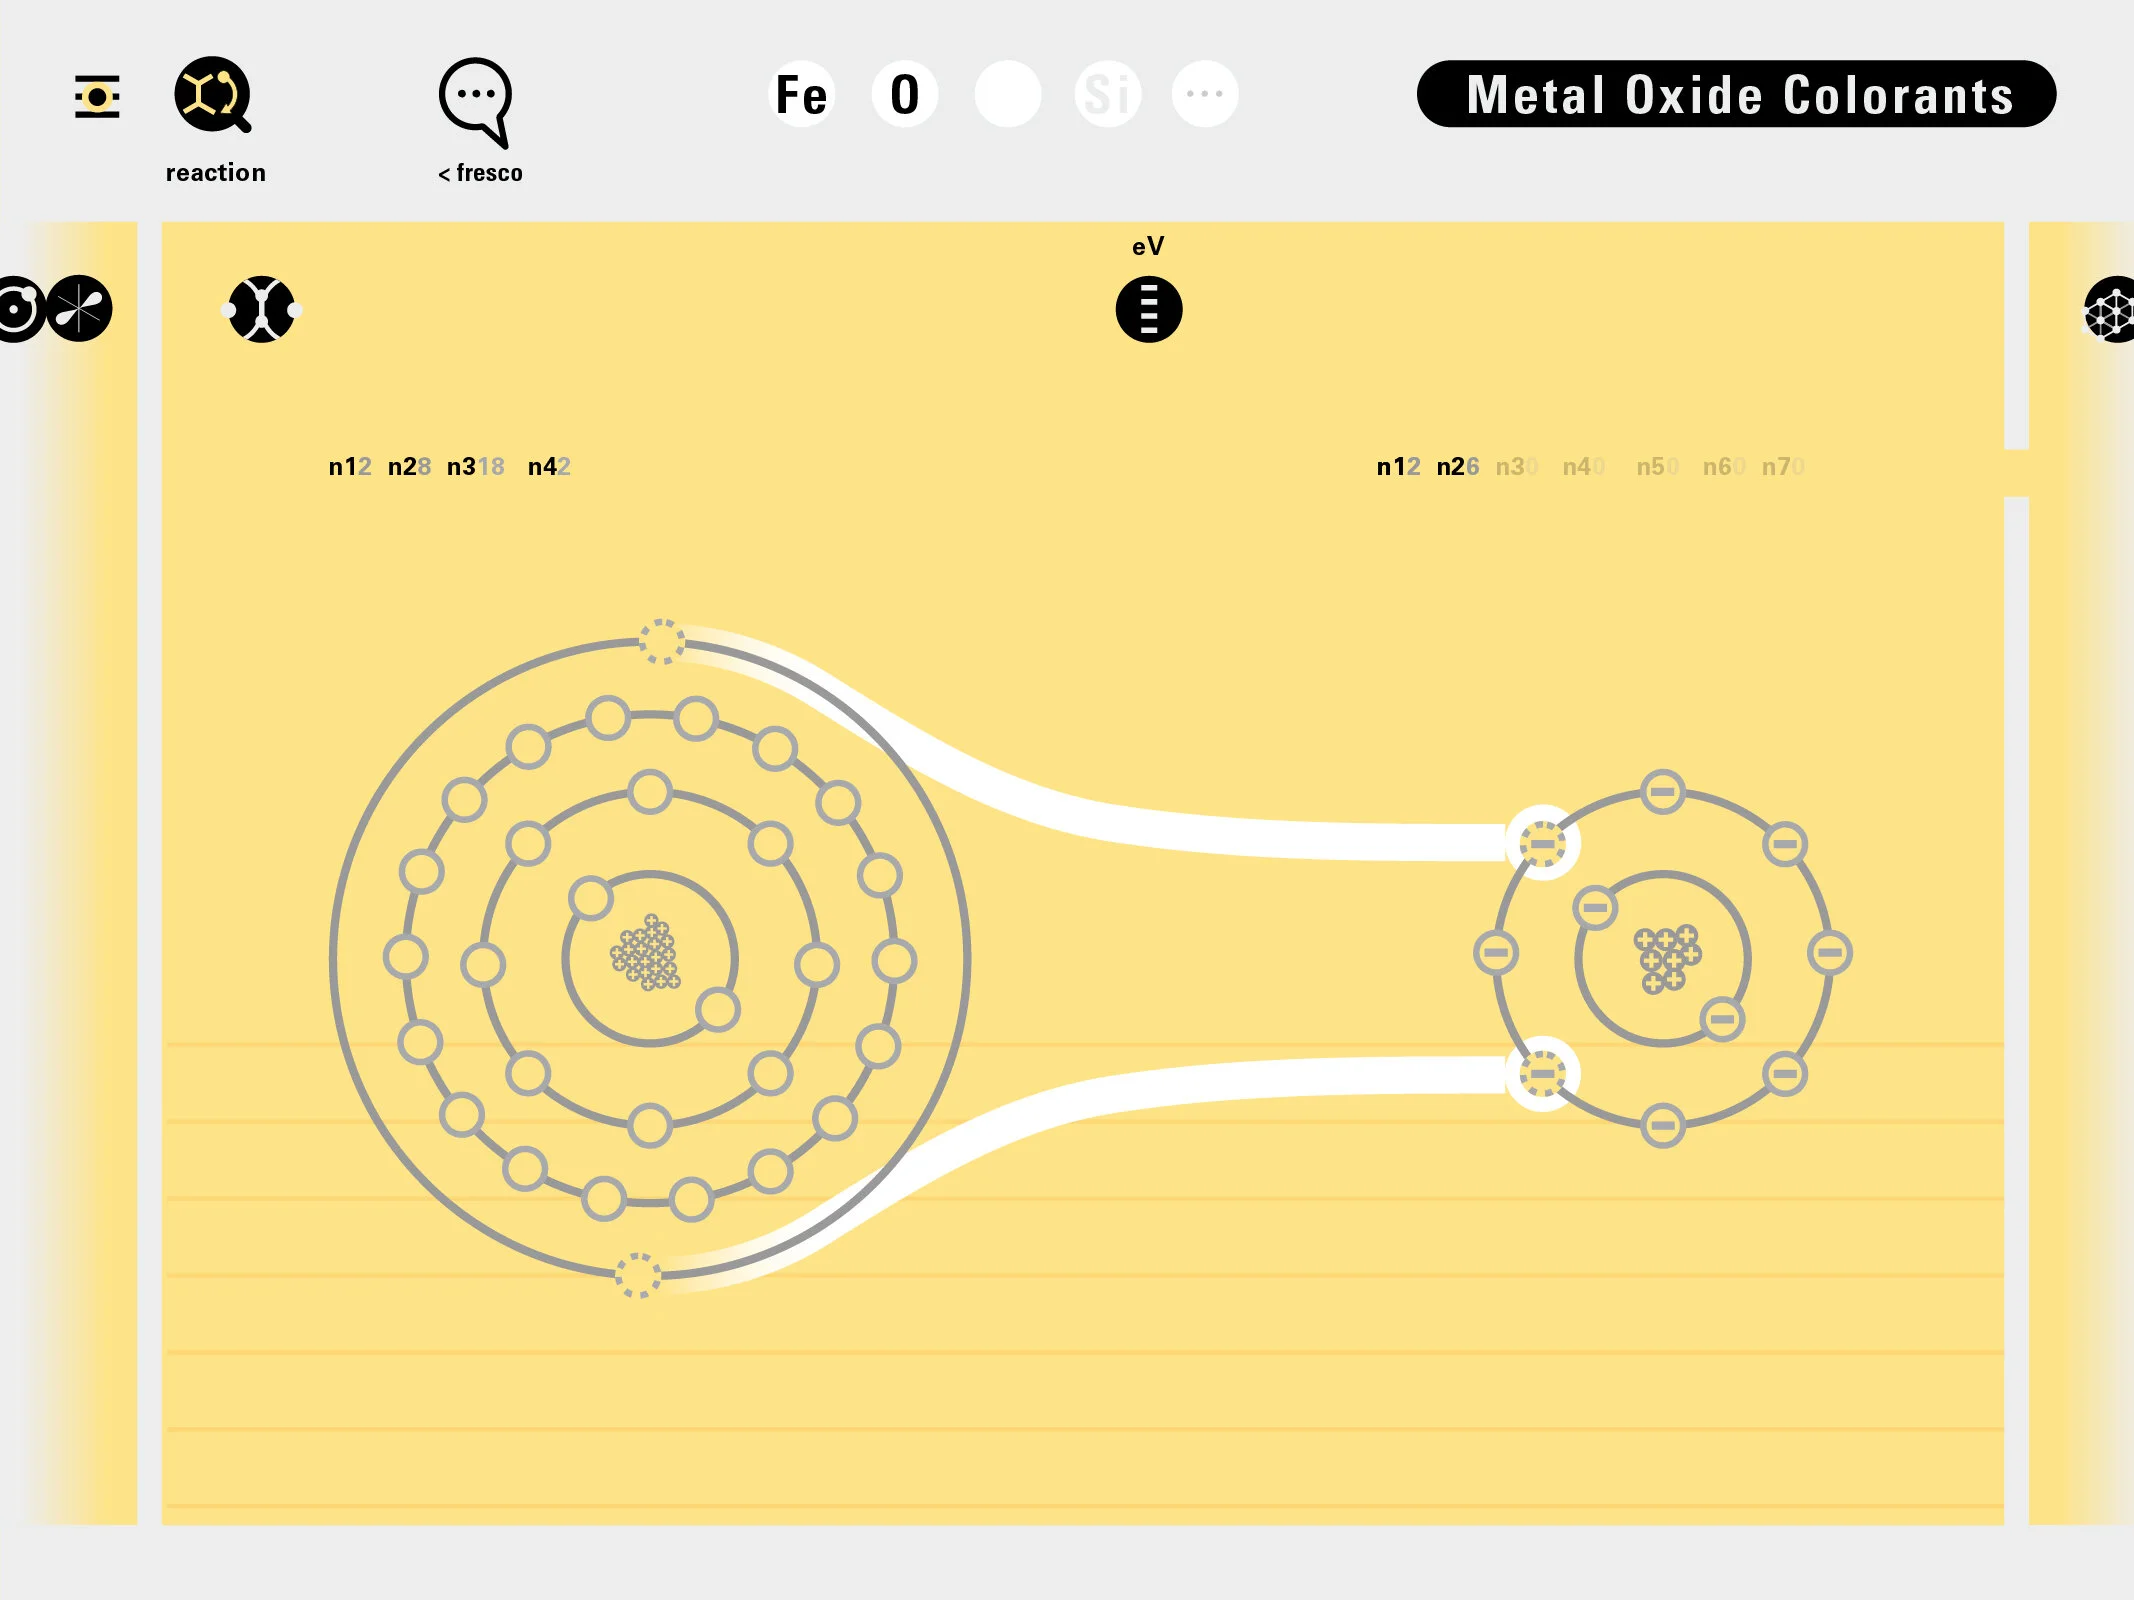
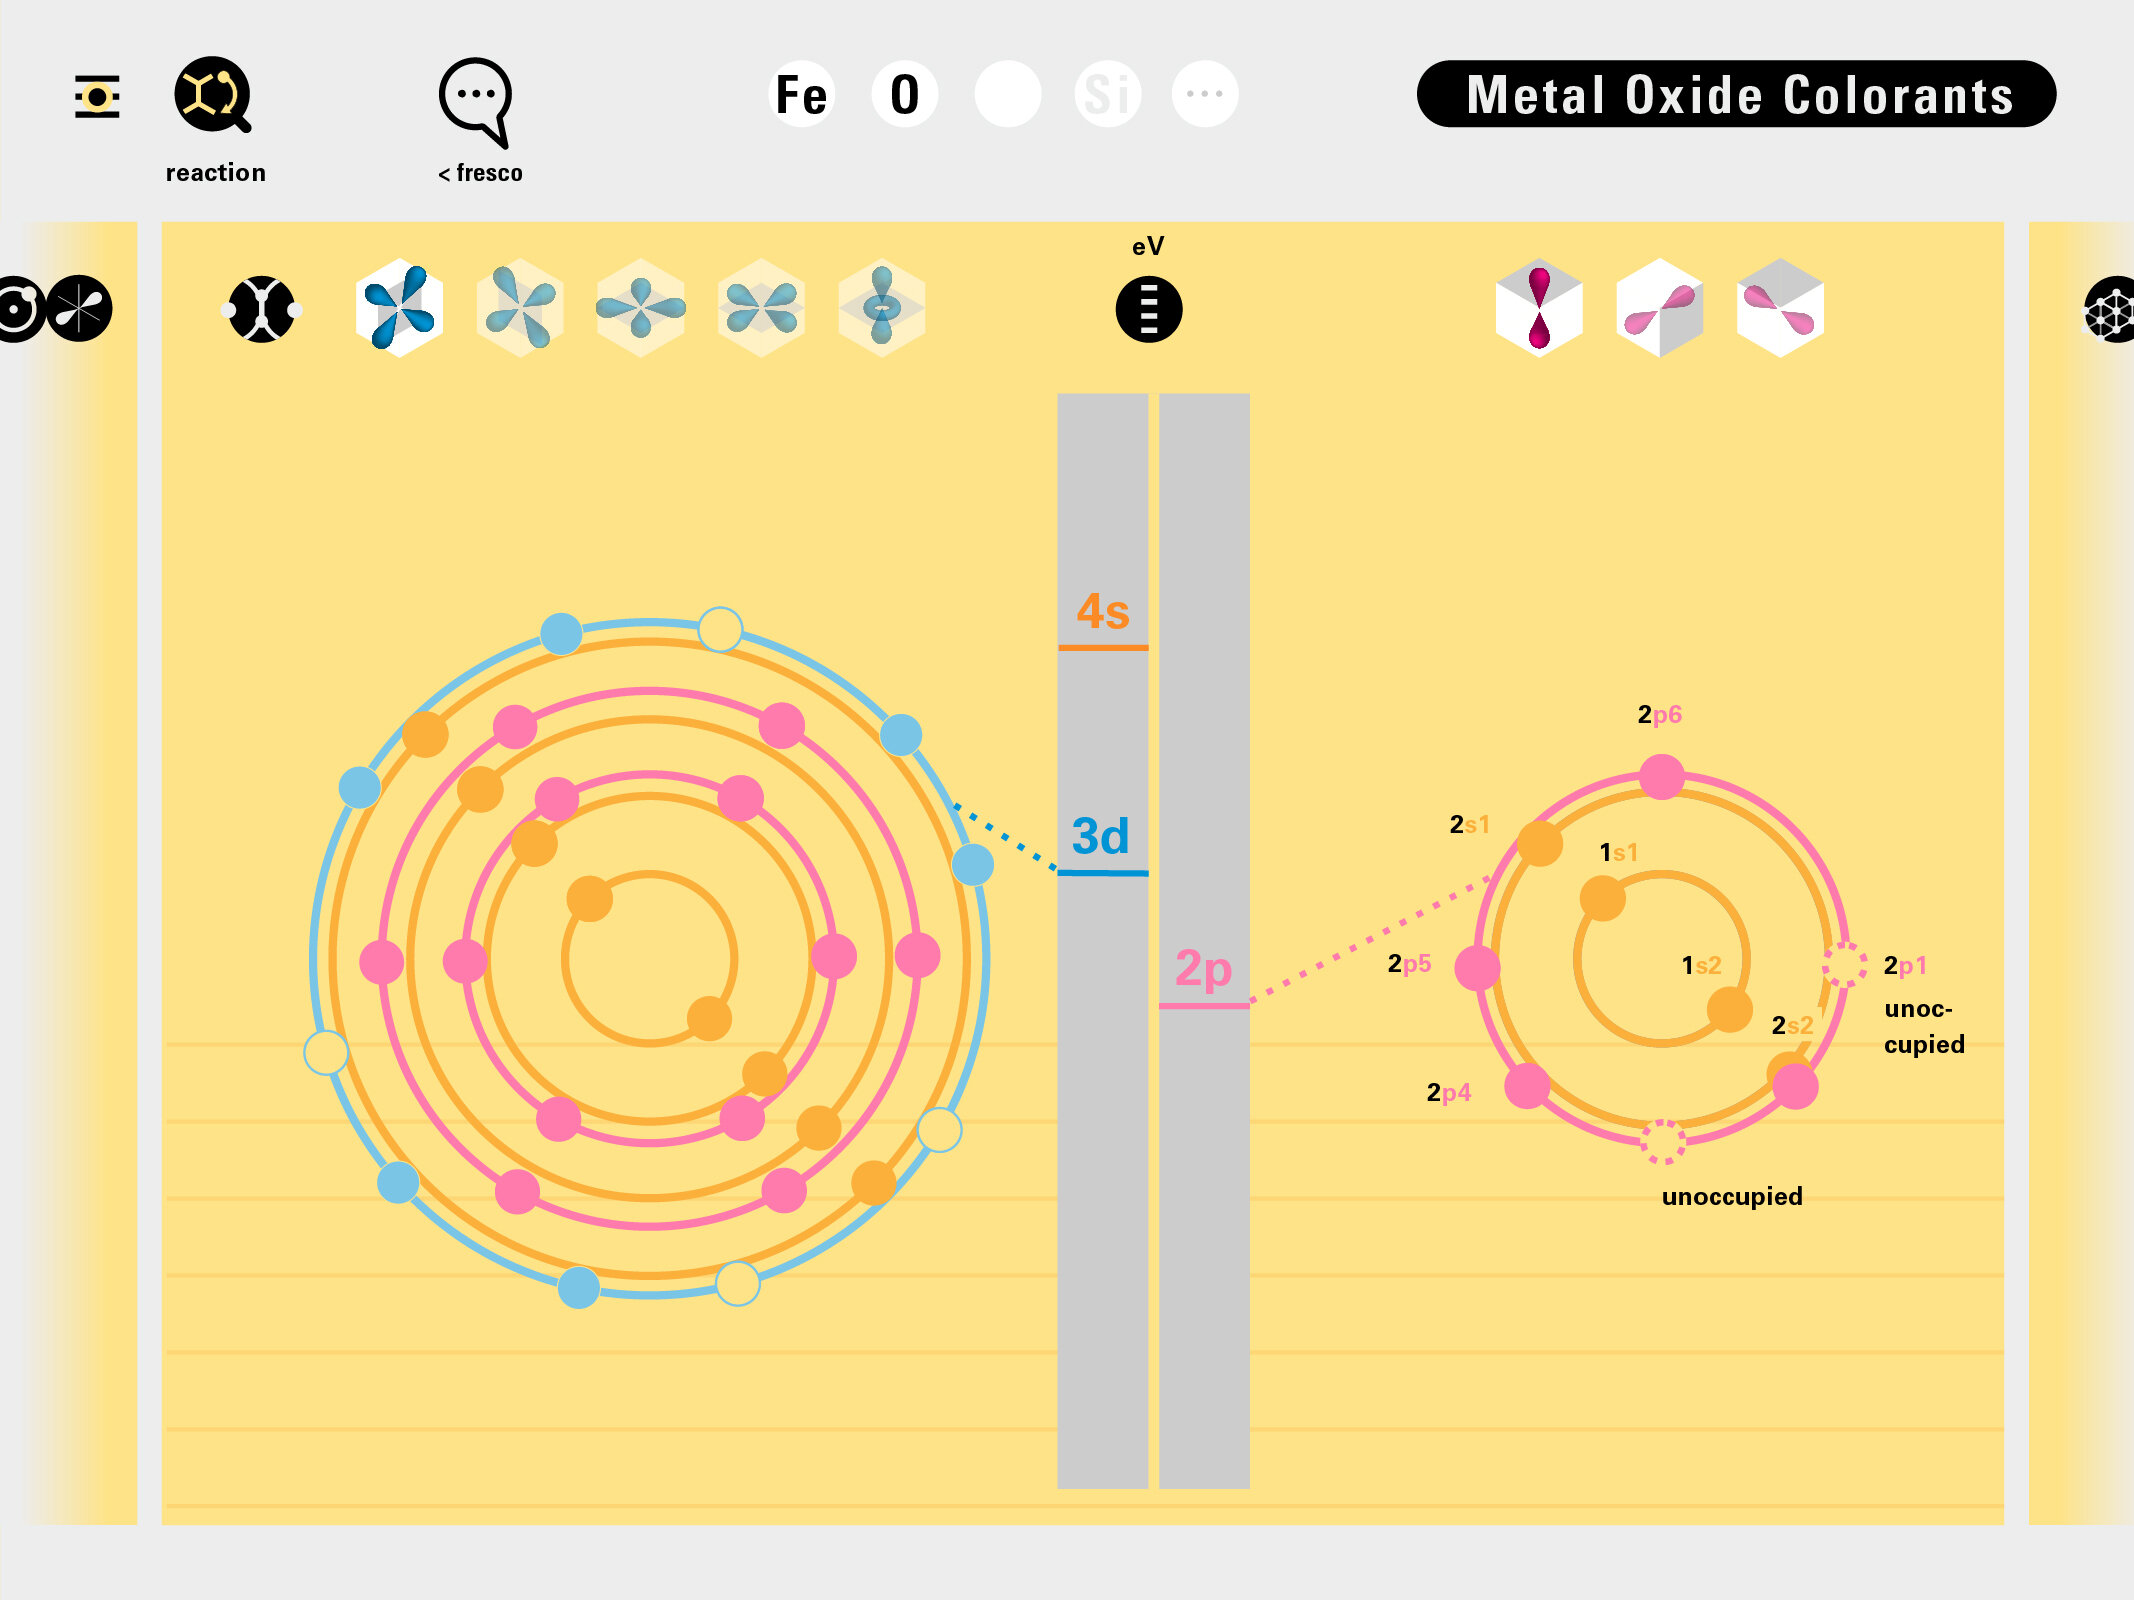
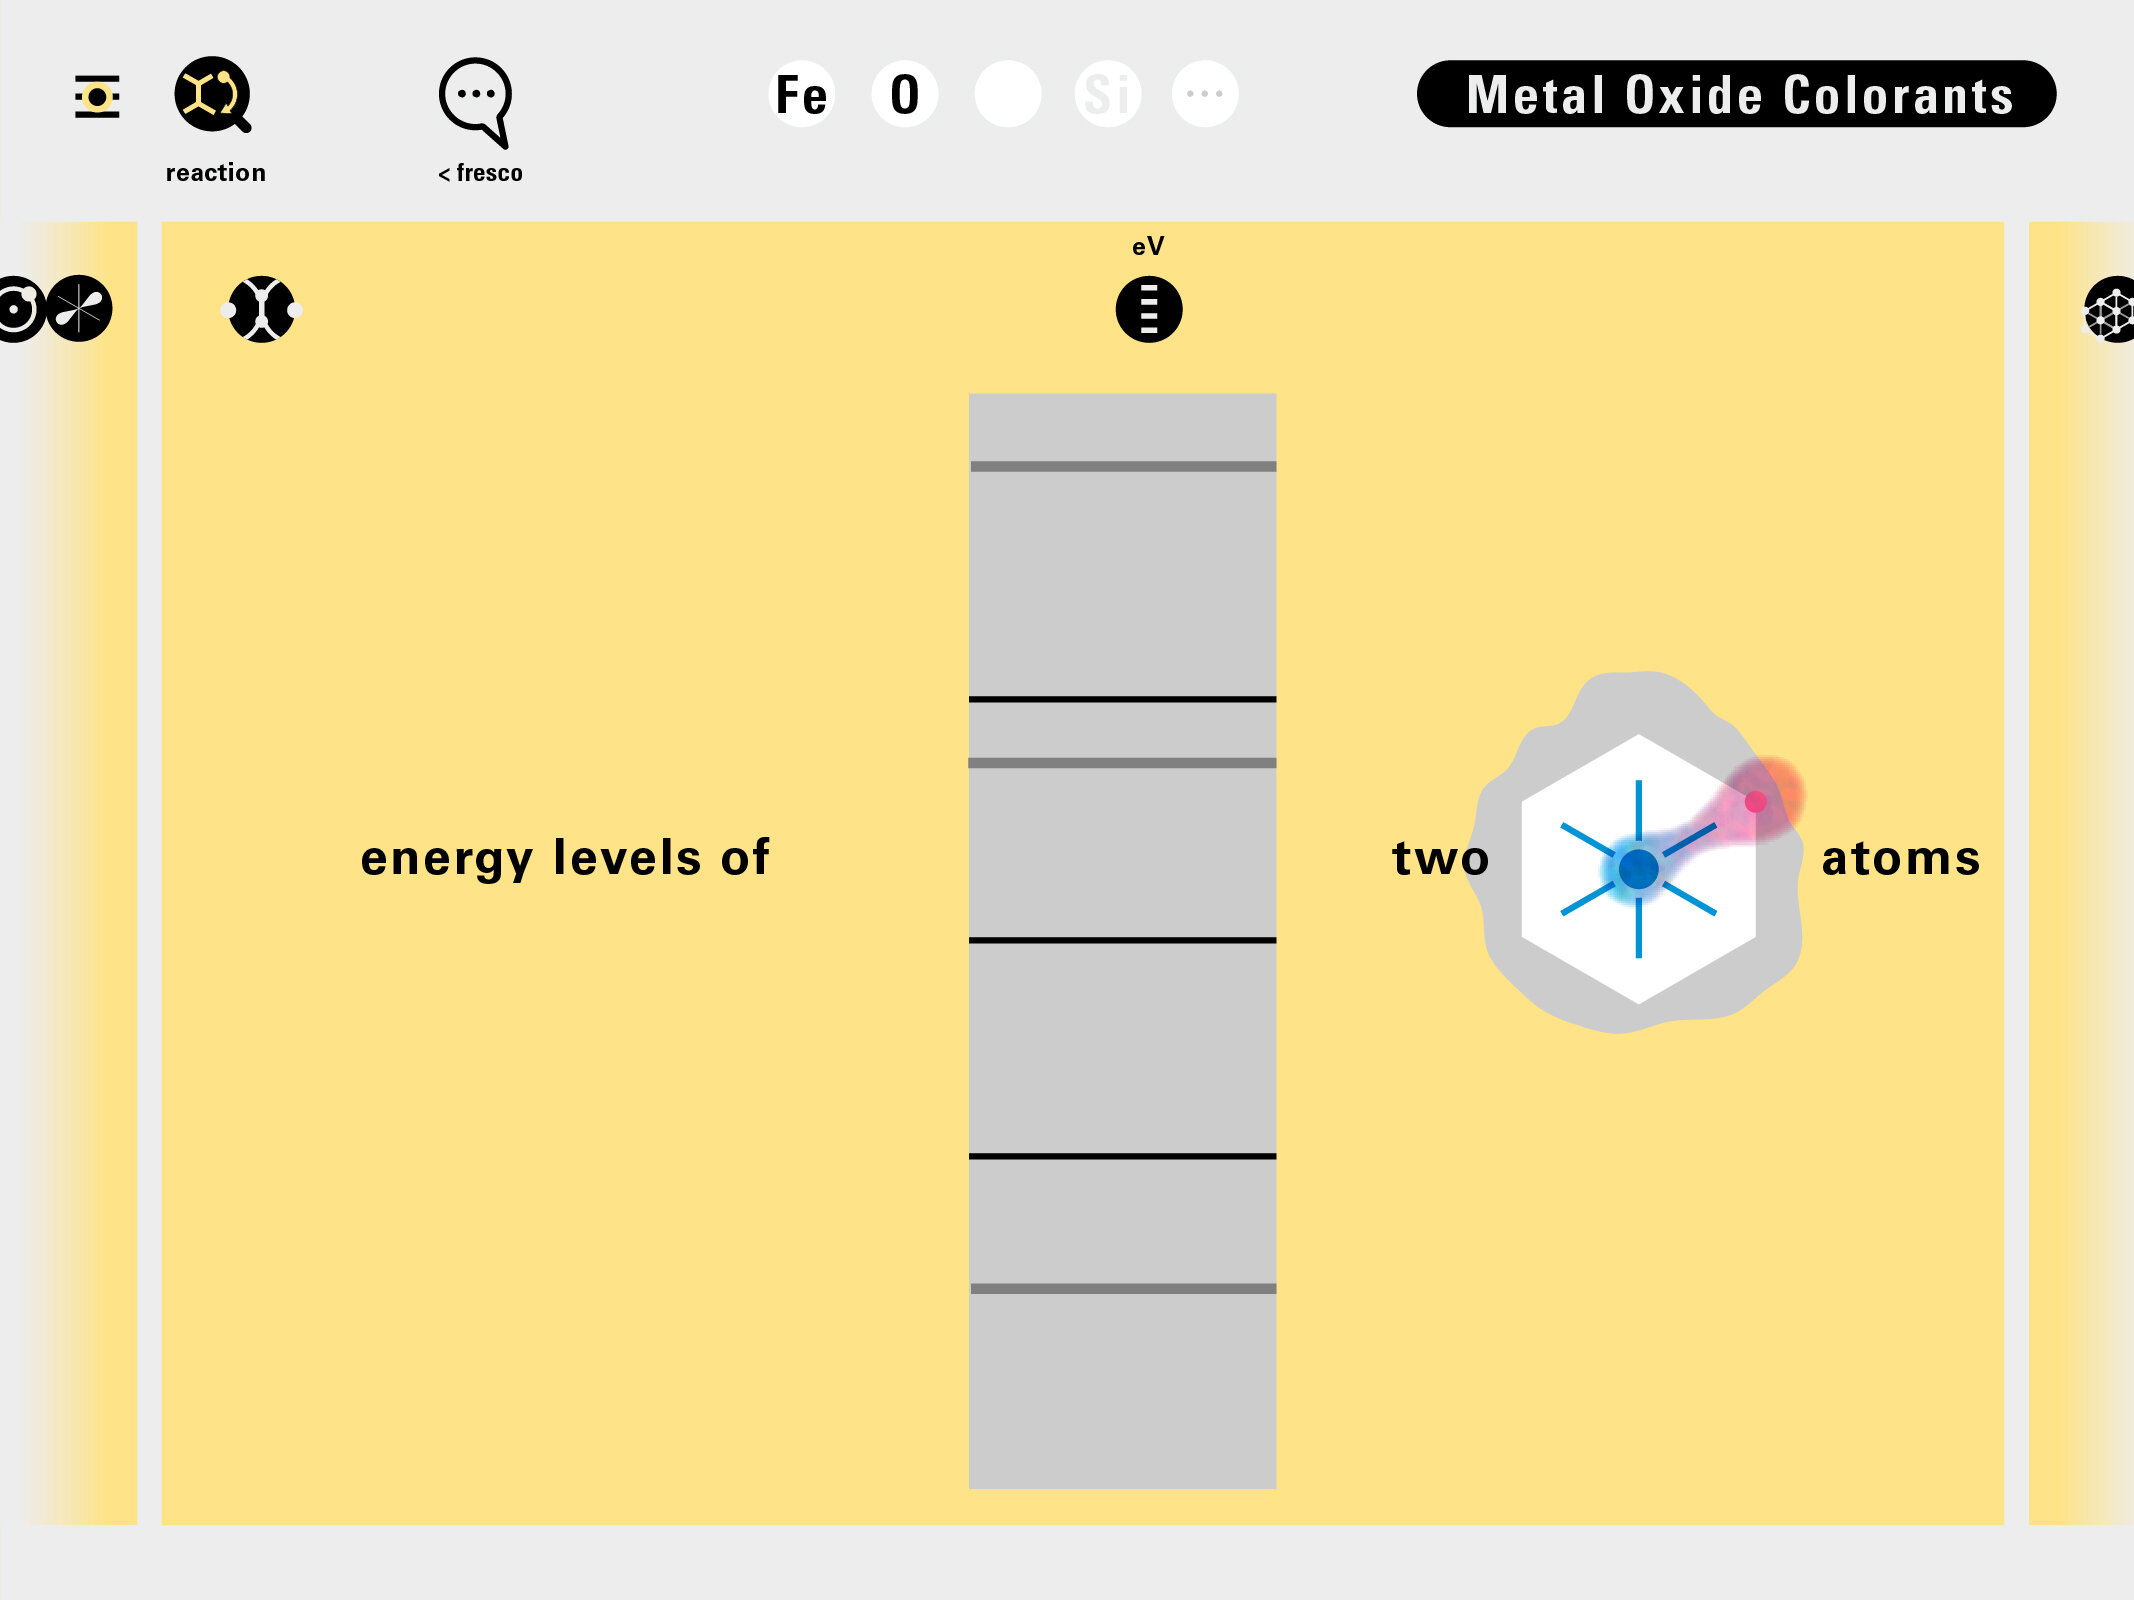
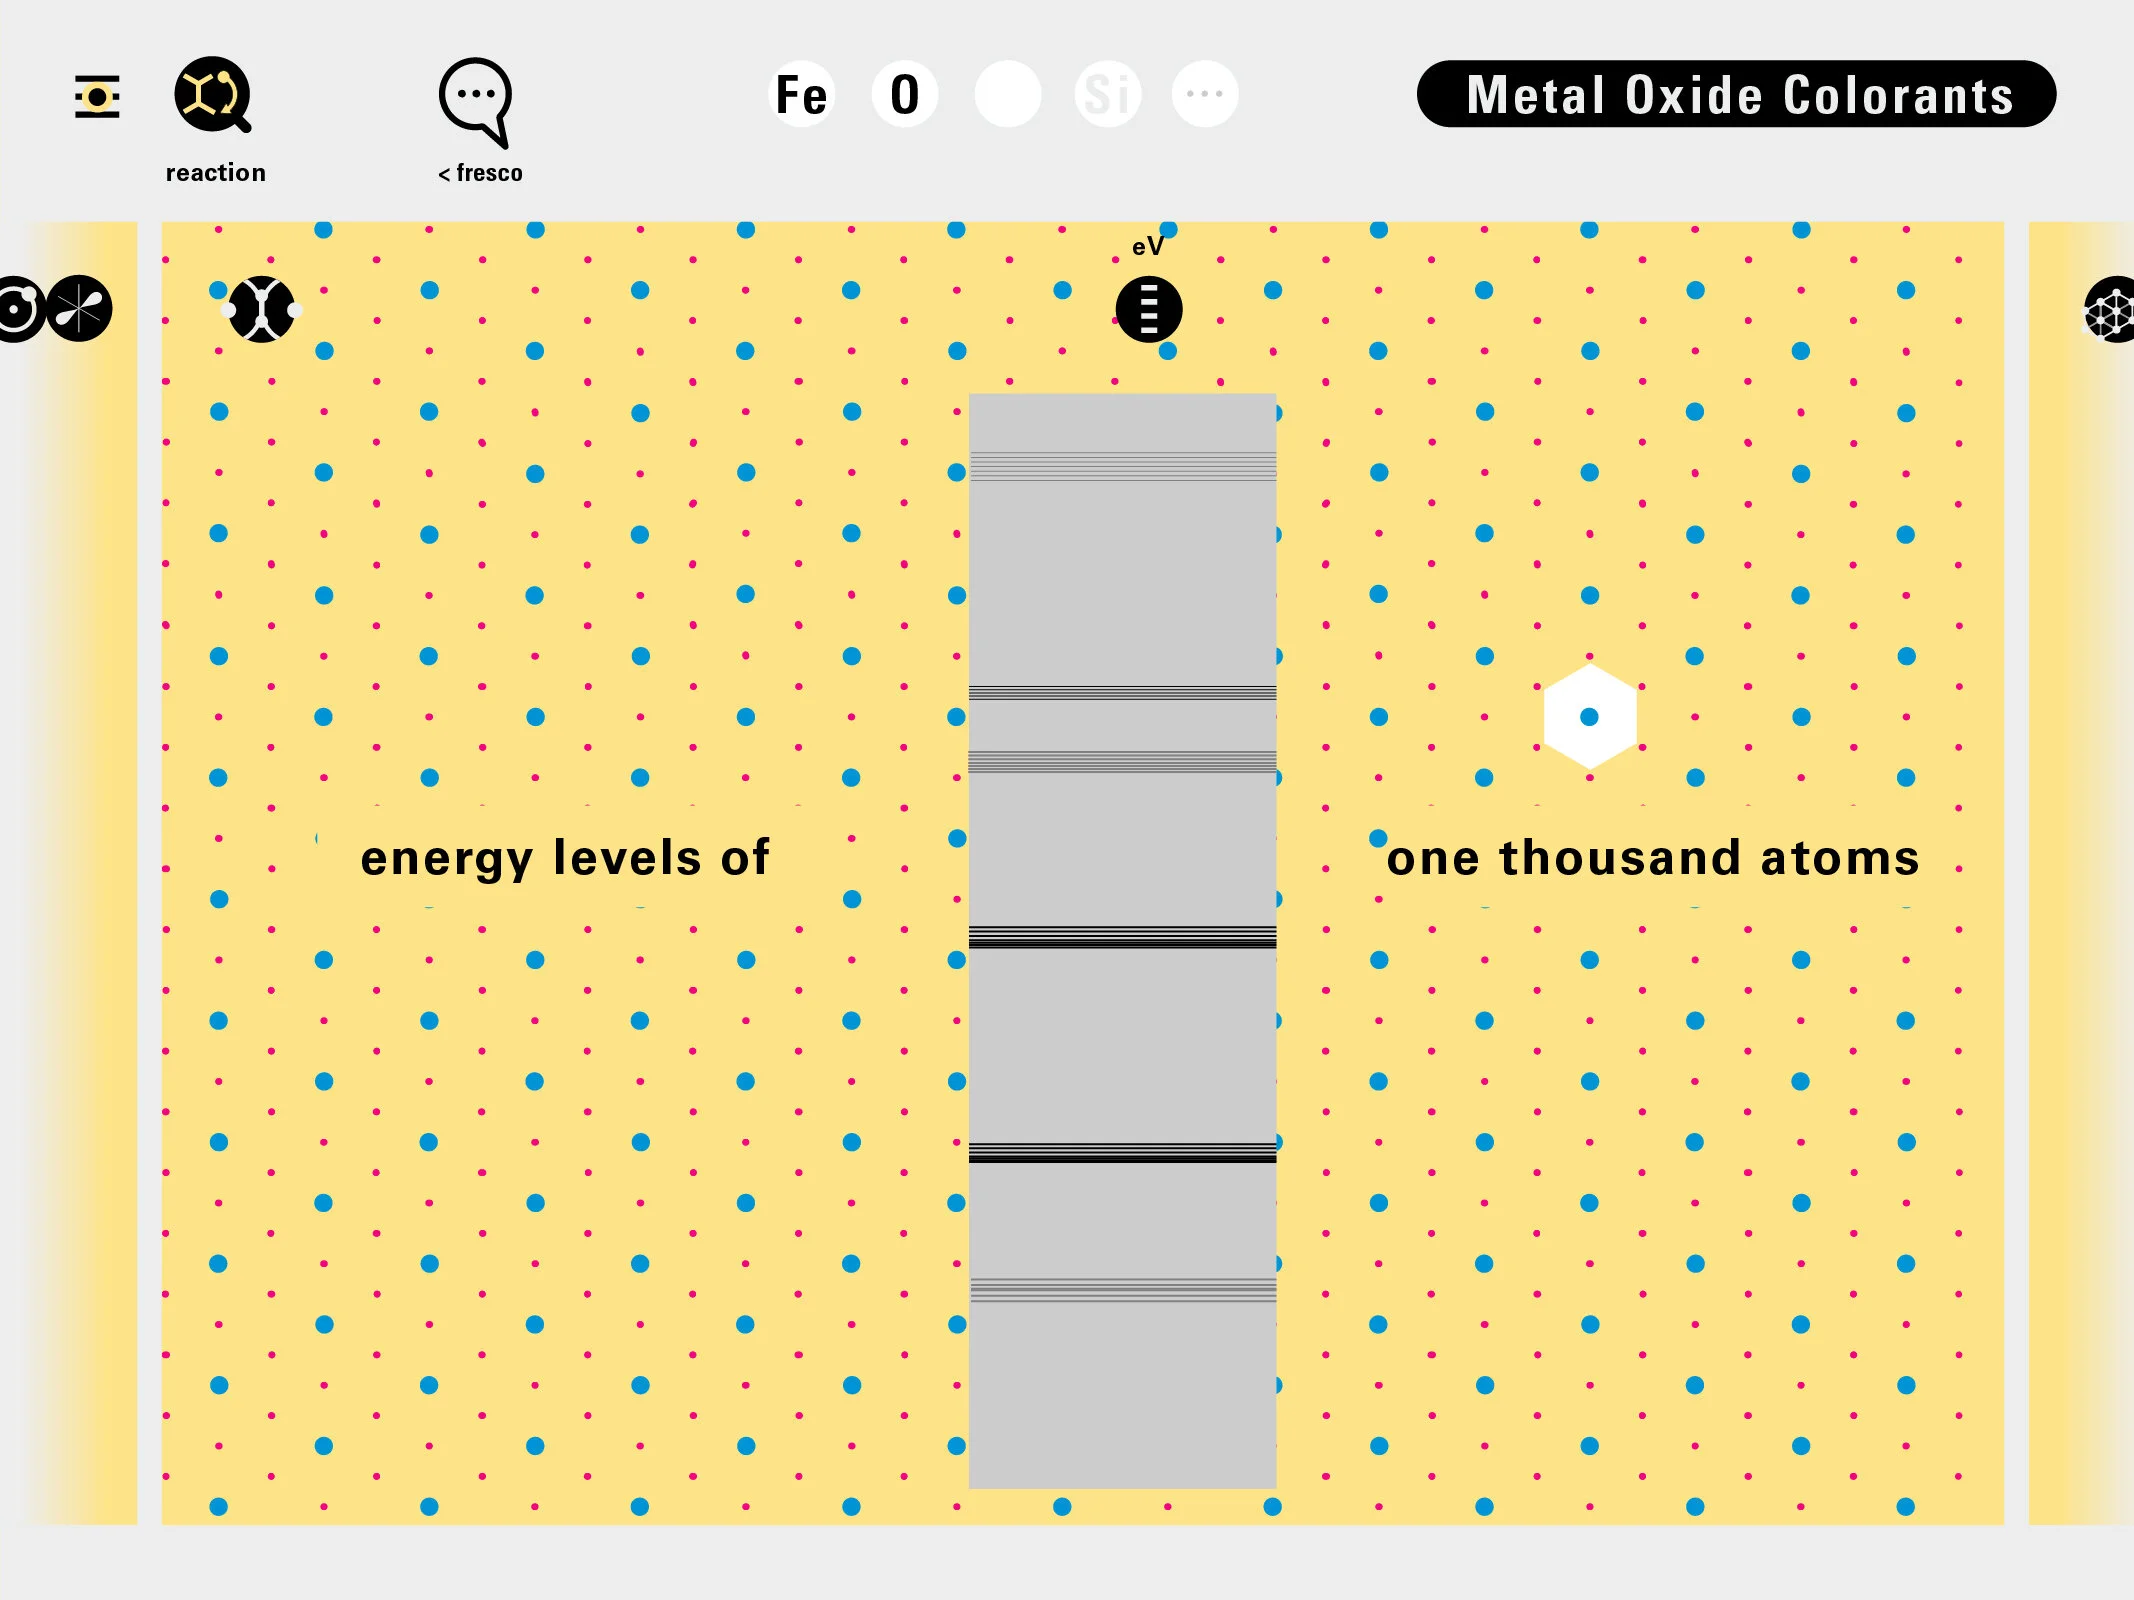
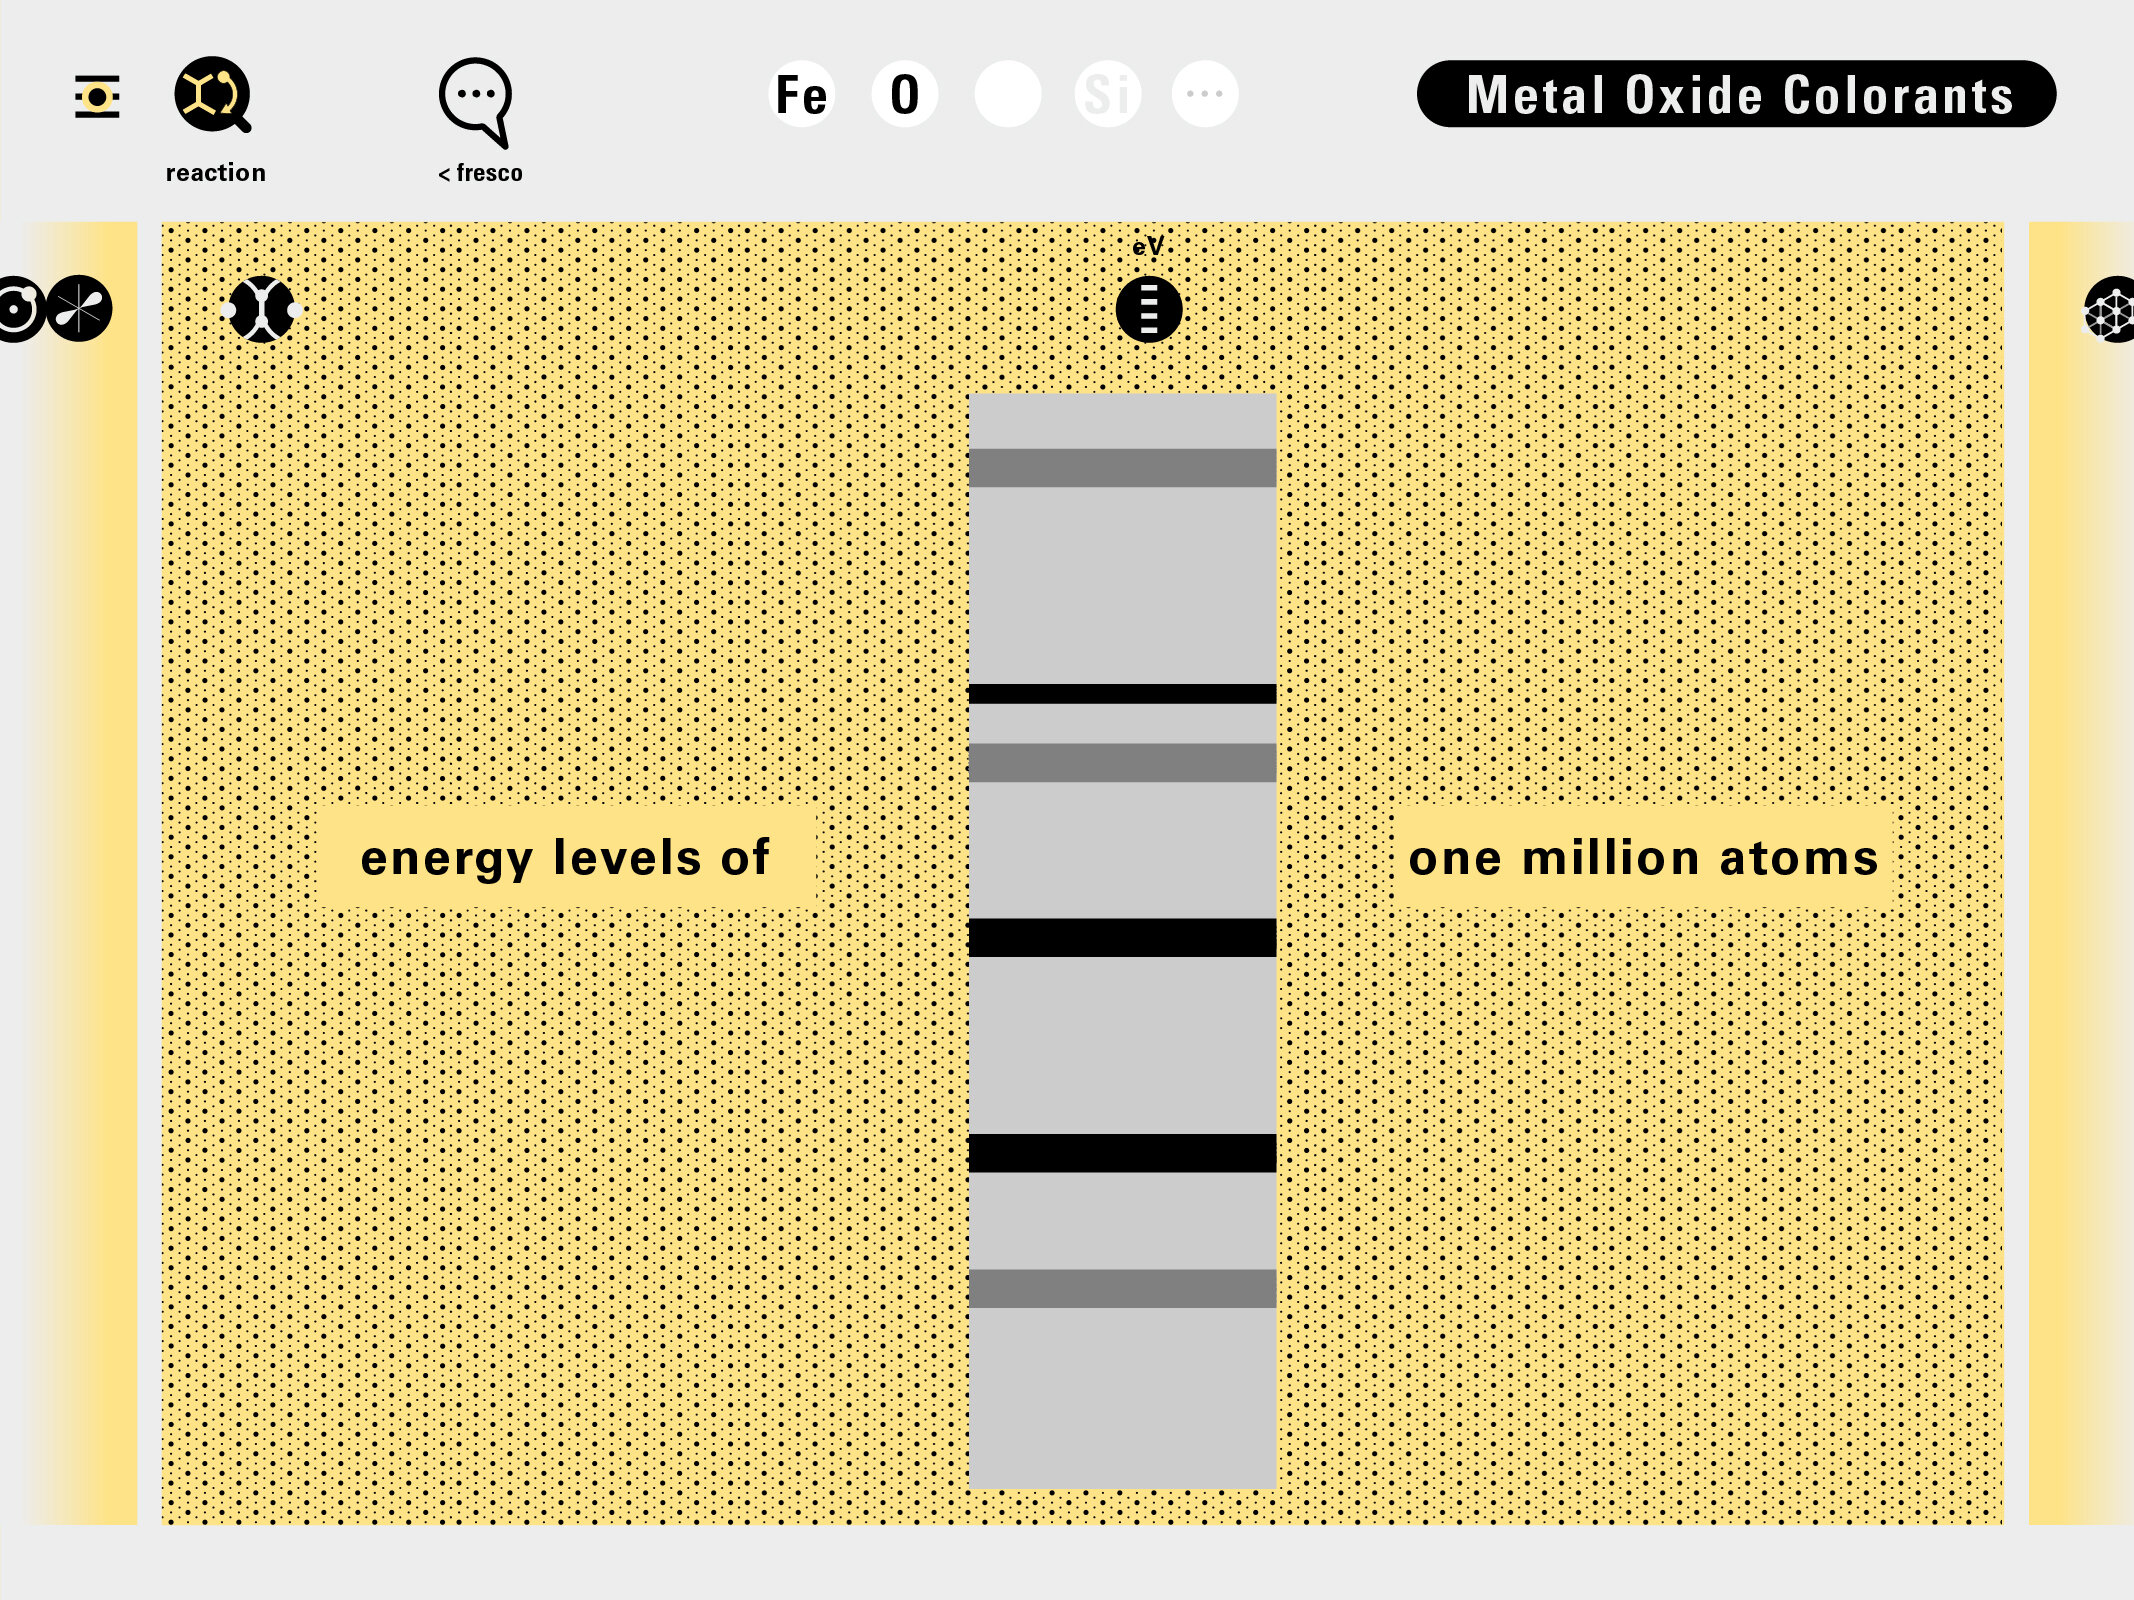
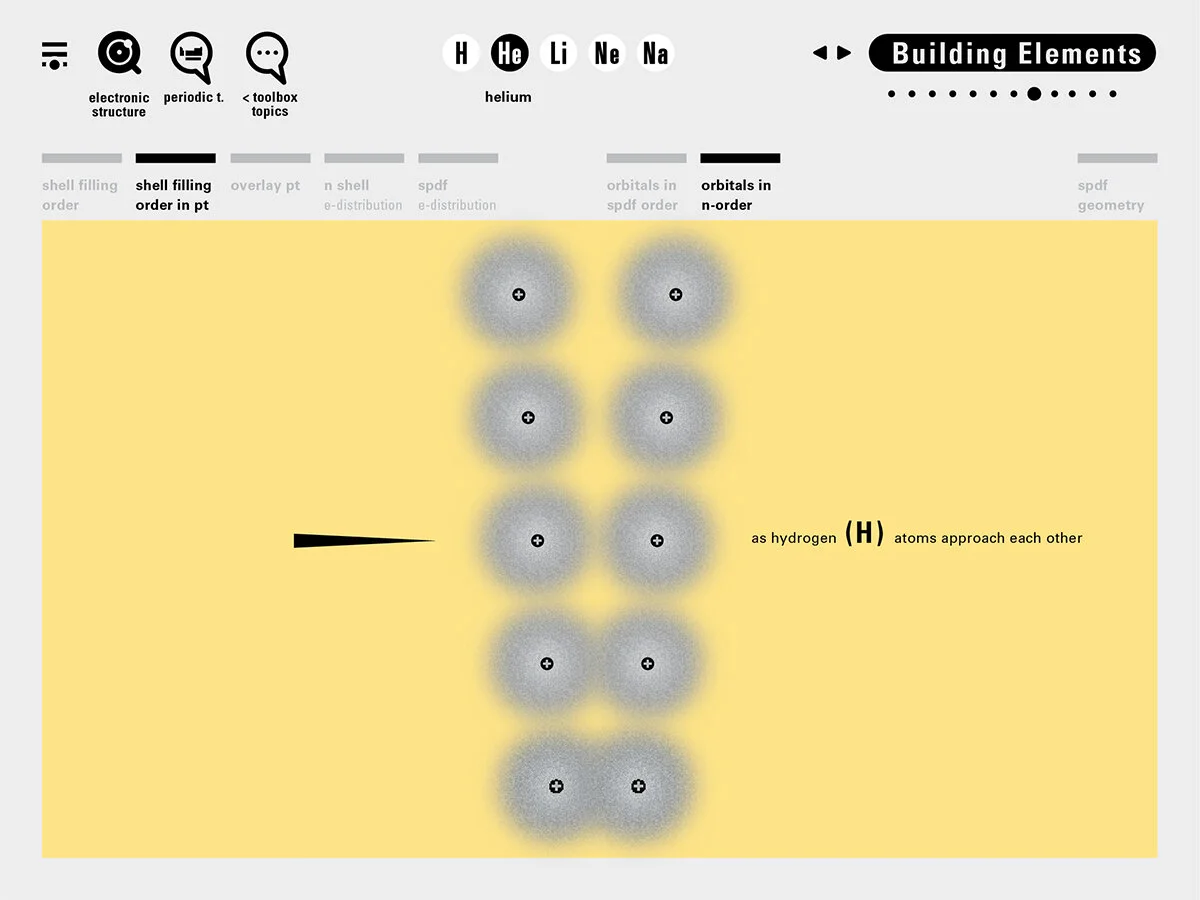
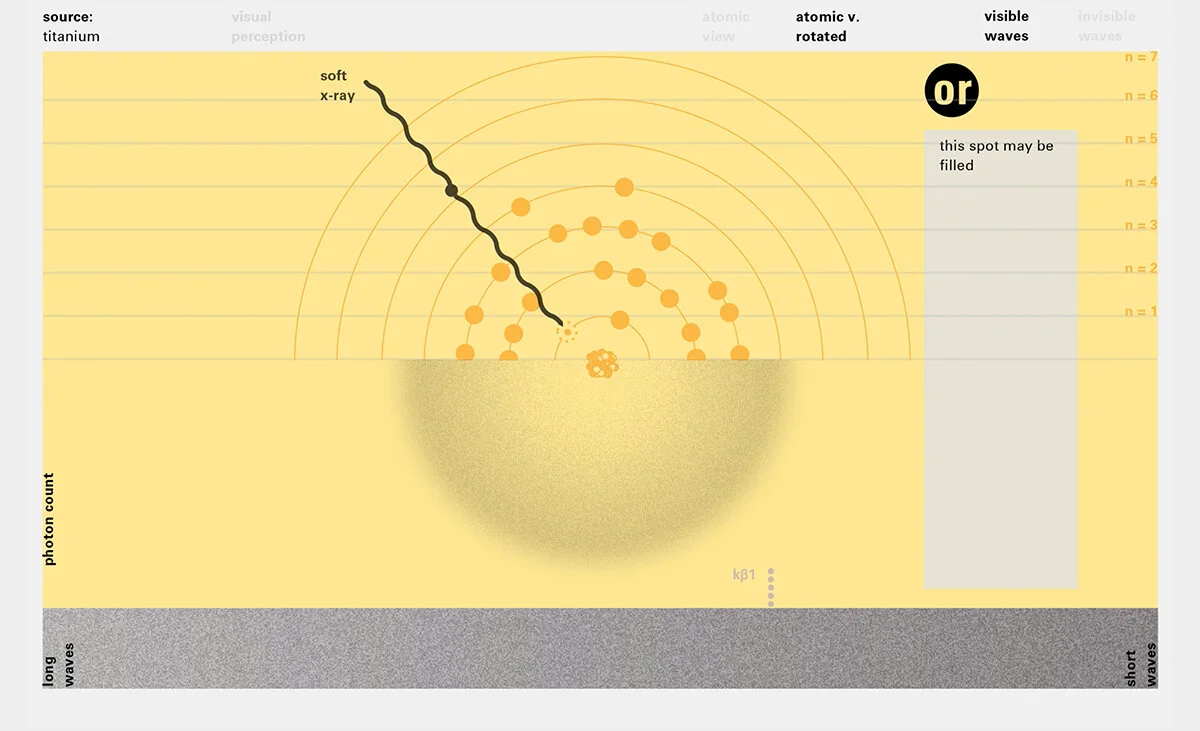
Todd Rutkowski and I conversed verbally and visually, on the blackboard and our notebooks, sketching back-and-forth in a feedback cycle that produced our design solution. We drew the purely hierarchical model of an element that represents it as stacks of energy values, and showed how this view paralleled with a simple spatial model of the atom (the Bohr model) that represents it as a bundle of concentric orbitals. Then, we paralleled both views with the rows of the periodic table where the element is situated. We can use this stage to show how larger atoms are built as they take on more outer shells, both in terms of primary and secondary quantum numbers. One can simultaneously view this progression on the periodic table (to the left) and on the energy band structure (juxtaposed on the Bohr-model).

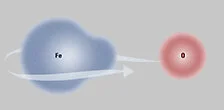
In an alternative view of our periodic table, users can look closer at how an element comes together as it struggles to balance its its negative outer shells (the electrons) with positive inner core (protons). This Bohr-model representation is paralleled with the element also placed on a periodic table row that hovers above the atom. On the same stage, viewers can count an atom’s number of bond-forming (‘valence’) electrons and see that number marking the column where the atom sits in. They can simultaneously count the atoms protons and see this marked as the ‘atomic number’ inside the periodic table cell. This is to say that a given row of the periodic table arranges elements from left to right in increasing order of an valence’ shell electrons.

I designed keyframes for this animation, while Jacklyn Chizner animated the designs during her summer scholarship in 2018 with advising from me and Kevin Lahoda.

Copyright © Louis Piper, Gökhan Ersan, SUNY, RF SUNY / 2017, 2018, 2019, 2020.  All rights reserved.  These Materials Matter digital infographics may not be published, reproduced, displayed, modified or distributed without the express prior written permission of the copyright holder. For permission, contact [gersan@binghamton.edu]

atom's-electronic-structure-ANIM.gif
pt as fullscreen.png
mm4-04-02-1200px.jpg
mm4-05.jpg

materials matter app module (2019) chemistry of fresco drying

I collaborated with Lynn Schmitt at Binghamton University chemistry department to design this module in order to support a Materials Matter lecture that discusses frescos. This motion graphic focuses on a crucial segment of the ‘lime cycle reaction’ that accounts for the chemistry behind how a fresco dries setting the pigments applied on its surface.

Our strategy was to parallel the visual representations of the drying process with corresponding chemical expressions. Once again, a motion graphic, presents the artifact at human scale, then closes in on it, to study chemical mechanisms at relevant scales.

Copyright © Louis Piper, Gökhan Ersan, SUNY, RF SUNY / 2017, 2018, 2019, 2020.  All rights reserved.  These Materials Matter digital infographics may not be published, reproduced, displayed, modified or distributed without the express prior written permission of the copyright holder. For permission, contact [gersan@binghamton.edu]

mm5-03.jpg
mm5-04.jpg

materials matter app module (2018) characterizing pigment

This module demonstrates our effort to use visual language to bring together humanistic and scientific discussions of artifacts. I collaborated with research assistant Todd Rutkowski from Binghamton University physics department to design this module to support discussions of characterizing the elemental sources of pigments.

Our challenge was to humanize the explanation of how a chemical analyzer produces its data. We create a hypothetical scheme. Our narrative stage displays a Baroque painting that is suspected to be a forgery. A person with a hand-held XRF analyzer approaches the painting and begins scanning its surface. The camera zooms into the analyzer and dives inside the device. It reveals an x-ray source that shoots photons into the sample, and a photon detector that collects the rebounding photons as data. The next sequence takes the viewer through the atomic lattice of the painting’s pigmented surface and stops at a single atom. We strip the atom’s outer electron cloud to reveal its inner mechanism—in order to truly explain how XRF does its magic. Then, we painstakingly show how the data is collected. A single x-ray would cause an inner electron from an atom to move up to a higher energy level, while a higher-energy electron fills the opening spot, and releases a residual amount of energy. This residual energy is recorded to as evidence to determine the source of the element that is analyzed.

Had the XRF detected titanium, it would mean that our painting was a forgery since Titanium pain was not available to Baroque painters. If lead was detected instead, then a more positive conclusion could be drawn.

This module is accessible through the a multi-scale page devoted to the discussion of a particular artifact, in this case, a Baroque painting.

Copyright © Louis Piper, Gökhan Ersan, SUNY, RF SUNY / 2017, 2018, 2019, 2020.  All rights reserved.  These Materials Matter digital infographics may not be published, reproduced, displayed, modified or distributed without the express prior written permission of the copyright holder. For permission, contact [gersan@binghamton.edu]

mm3-02.jpg
mm3-03.jpg
mm3-04.jpg
mm3-05.jpg
mm3-06.jpg
mm3-07.jpg
mm3-08.jpg
mm3-09.jpg
mm3-10.jpg
mm3-11.jpg
mm3-12.jpg
mm3-13.jpg
mm3-14.jpg
mm3-15.jpg

elements of nuvolone (2018) infographic

This infographic, designed from geologist Dick Naslund and archaeologist Hilary Becker’s data, was featured in The Binghamton Nuvolone: Restoring an Object in Six Parts exhibition at the Binghamton University Art Museum.

I also designed a motion-graphic that is related to this image as a Materials Matter App module that provides access to conceptual and dimensional layers of artifacts through infographics. Materials Matter App is an NEH-funded educational tool that I am developing with colleagues at Binghamton University—from materials science, art history, anthropology, classical archaeology, and geology.

nu-thumb-01.jpg
nu-04.jpg

water splitting infographic (2017)

Infographic representing the creation of solar fuel by the “water-splitting” process. I was credited as co-author for this science outreach article for my graphical contribution to the experimental design process. (“Nanoengineered lone-pair active photocatalysts for more efficient water splitting,” with Louis Piper, Sarbajit Banerjee and David Watson, SPIE Newsroom, 4 April 2017.)

A motion-graphic and exhibition piece followed, demonstrating the collaborative design process that produced the infographic. The panels demonstrate the influence of design process (visual encoding, staging, and conveying action) in researchers’ thinking and their conception of the final product. The motion-graphic demonstrates the way in which researchers envisioned the process of “water-splitting.” (Thinking About Drawing, Tower Fine Arts Gallery: The College at Brockport, Brockport, NY.)

ws-01-cover.png
po-01b-10.jpg

water splitting in exhibition (2017)

Thinking About Drawing, Tower Fine Arts Gallery: The College at Brockport, Brockport, NY.

This work demonstrates the collaborative design process that produced the infographic that lead the science article (“Nanoengineered lone-pair active photocatalysts for more efficient water splitting,” with Louis Piper, Sarbajit Banerjee and David Watson, SPIE Newsroom, 4 April 2017). The panels demonstrate the influence of design process (visual encoding, staging, and conveying action) in researcher’s thinking and their conception of the final product. An animation demonstrates the way in which researchers envisioned the process of “water-splitting.”

click here to see the larger graphic

po01b-01.png
po-01b-08.jpg
po-01b-03.png
po-01b-04.png
po-01b-05.png
po-01b-06.png
po-01b-00.jpg

speak to the eyes (2017) exhibition and motion-graphic

click here to view my motion graphic

“Speak to the eyes: Visualizing Information from the Ottoman era to the Republic,” traveling exhibition

Studio-X, Istanbul, May 18 – July 7, 2017.

Printtek 2017, October 4-8, 2017 at Tüyap Fair, Convention and Congress Center, İstanbul.

I served as academic advisor and designer for this design history and research exhibition curated by Ömer Durmaz. The exhibition focuses on information visualizations produced by the Turkish government to disseminate reforms during the early 20th century. Curator Durmaz wanted viewers to explore layers of these historical data graphics through animations. I designed the first animation, providing a strategy to guide the other contributions.

At the core of this exhibition is a gallery of 10 data visualizations from the covers of early 20th century government journals that were animated by 10 designers. Animations peel semantic layers of these historical documents. Consequently, designers comment on how these graphics balance aesthetic value and visual impact with data clarity.

po05-11.png
po05-12.png
po05-13.png
po05-14.png
po05-15.png
po05-16.png
po05-17.png
po05-18.png
po05-19.png
po05-20.png
po05-01.png
po05-02.png
po05-04.png

materials science poster (2010)

Poster exploring a concise and clear graphical expression of “synthesis,” an experimental procedure devised to improve the nano scale usage of polymeric film. The design was realized during the grant-funded Image of Science workshop that brought researchers and designers together to explore jargon-free expressions of research projects.

click here for the larger poster

po1-isci4-2.png
po1-isci4.jpg

political science poster (2010)

This graphic was designed during the grant-funded Image of Science workshop. It displays the correlation between voters' adherence to group norms and their potency to influence politics in five demographic categories, and according to party affiliation. The correlations are explored in four quadrants. Mini graphics derived from the main graphic highlight and explain the significant results of this survey.

click here to view the larger version

po1-iscie5-1.jpg
po1-isci5.jpg

image of science (2010-12) workshops, web-portal

Funded by a research grant in 2010, image of science workshops aimed to foster interdisciplinary collaboration; technology based applications; and dissemination of research within the international academic community. During the first three day workshop, researchers, designers, and language assistants explored concise and clear visual-verbal expressions of research problems.

image of science's research and development of a design method for scientific projects produced 9 research posters for conference  presentations and academic papers. 

The second image of science workshop in 2011 focused on adding interaction and motion to presentations.

click here to visit the iscience website

po1-isci1-0.png
po1-isci1-2.jpg
isci-11-1-72dpi.png
isci-11-2-72dpi.png
  click here for the interactive version

click here for the interactive version

  click here for the animated version

click here for the animated version

New Gallery

New Gallery

New Gallery

New Gallery

prev / next
Back to INFORMATION DESIGN
nth-00-thumb-3.jpg
2
future work : environmental graphics (2020-) for nuthatch hollow
wt-00-thumb-b.png
0
future work : wind tunnel (2020-) infographic
co2-00-thumb-2.jpg
31
cognitive art of CO2 (2020) artist's book
ssp-00-thumb-k.jpg
0
saving and spending in the usa (2020) test-2
4
intelligence emerges (2018) cover art for the design issues journal
toc-oo-thumb-6.jpg
0
table of contents graphics (2017-present)
st0-00-thumb-2.jpg
5
STEM Toolbox app (2019-present)
st1-00-thumb-1.jpg
14
STEM Toolbox module (2020) HAXPES
st2-00-thumb-2.jpg
2
STEM Toolbox module (2020) Li-ion battery
st3-00-thumb-5.jpg
10
STEM Toolbox module (2019) Mem-diode
st4-00-thumb-5.jpg
10
STEM Toolbox module (2019) why is emerald green?
st5-00-thumb-2.jpg
17
STEM Toolbox module (2019) covalent bonding
mm0-00-thumb-5.jpg
2
materials matter app (2017-present)
mm2-00-thumb.jpg
15
materials matter app module (2017) light-matter interactions
mm4-00-thumb-2.jpg
6
materials matter app module (2017) cross-referenced periodic table
mm5-00-thumb.jpg
3
materials matter app module (2019) chemistry of fresco drying
mm3-00-thumb-2.jpg
15
materials matter app module (2018) characterizing pigment
2
elements of nuvolone (2018) infographic
po01-thumb.png
3
water splitting motion-graphic and exhibition (2017)
po-01b-thumb-4.png
7
water splitting in exhibition (2017)
po05-thumb.png
13
speak to the eyes (2017) exhibition and motion-graphic
po1-isci4-2.png
2
materials science poster (2010)
2
political science poster (2010)
6
image of science (2010-12) workshops, web-portal
0
New Gallery
0
New Gallery
0
New Gallery
0
New Gallery

Powered by Squarespace