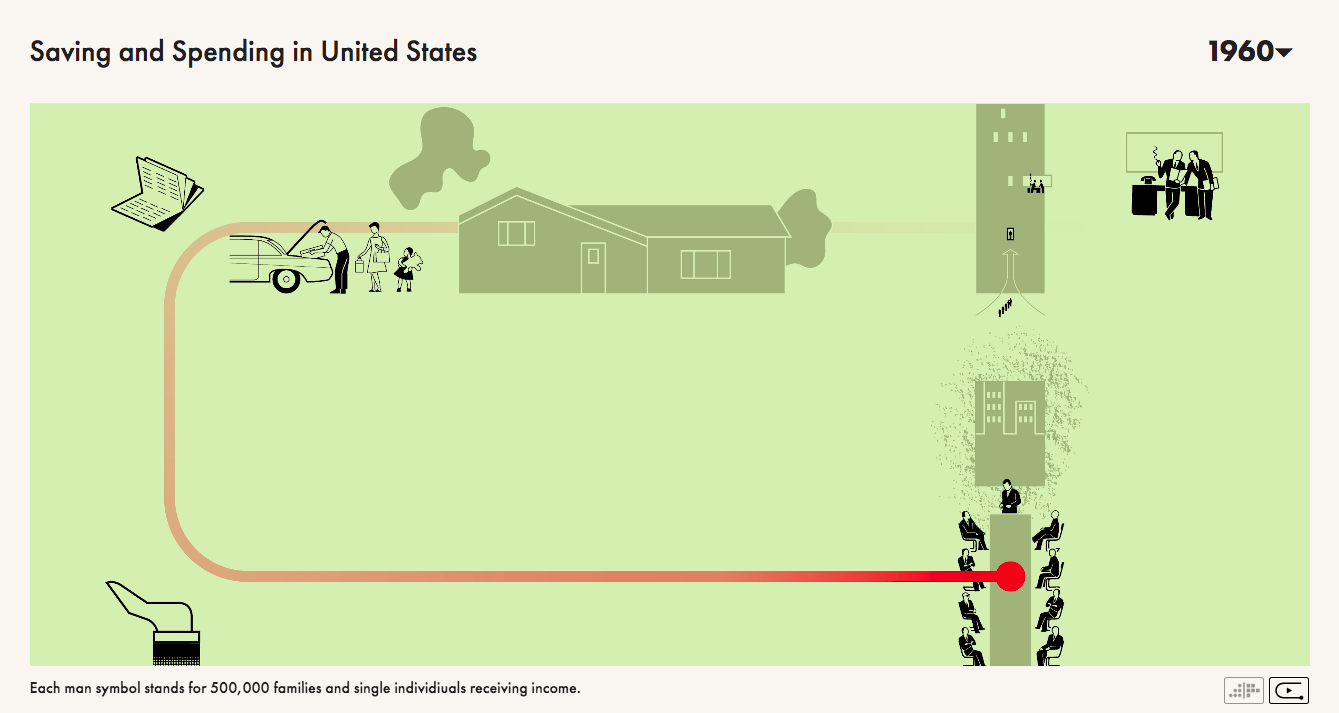
saving and spending in the usa (2020)
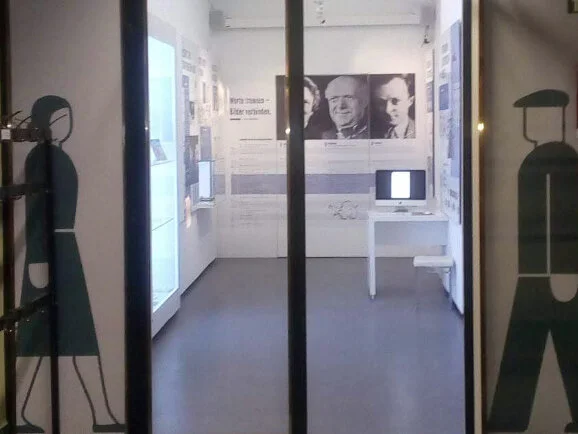
interactive infographic / screening at Wirtschaftsmuseum, Vienna
Interactive datagraphic re-imagining a classic ISOTYPE chart to inquire upon the economic status of the American middle class after WWII. I designed the visual framework and storytelling, while my collaborator Kevin Lahoda developed the database-driven interactive app. This work was screened at the Gesellschafts und Wirtschafts museum in Vienna, where Otto Neurath and his collaborators had developed the ISOTYPE method of pictorial statistics. It was presented in conjunction with other infographics that are being developed at Binghamton University, demonstrating the value of the ISOTYPE method for today’s communication challenges.
Leaflet announcing lecture and screening at the GW museum, Vienna
Leaflet in English


